# Unable to get PostgreSQL performance in packetbeat
**URL:** https://discuss.elastic.co/t/unable-to-get-postgresql-performance-in-packetbeat/43477
**Category:** Beats
**Tags:** packetbeat
**Created:** [March 4, 2016, 6:10am UTC](https://discuss.elastic.co/t/unable-to-get-postgresql-performance-in-packetbeat/43477 "2016-03-04T06:10:59Z")
**Posts on this page:** 15
**Page:** 1
### Author:  [@abcfy2](https://discuss.elastic.co/u/abcfy2)
#### Post date: [March 4, 2016, 6:10am UTC](https://discuss.elastic.co/t/unable-to-get-postgresql-performance-in-packetbeat/43477/1 "2016-03-04T06:10:59Z")
I install the PostgreSQL from official repo on Ubuntu 14.04 LTS. Here is the postgresql config(Almost keep the default, but remove the comment lines.)
```auto
# cat /etc/postgresql/9.4/main/postgresql.conf
data_directory = '/var/lib/postgresql/9.4/main'
hba_file = '/etc/postgresql/9.4/main/pg_hba.conf'
ident_file = '/etc/postgresql/9.4/main/pg_ident.conf'
external_pid_file = '/var/run/postgresql/9.4-main.pid'
listen_addresses = '*'
port = 5432
max_connections = 100
unix_socket_directories = '/var/run/postgresql'
ssl = true
ssl_cert_file = '/etc/ssl/certs/ssl-cert-snakeoil.pem'
ssl_key_file = '/etc/ssl/private/ssl-cert-snakeoil.key'
shared_buffers = 128MB
dynamic_shared_memory_type = posix
log_line_prefix = '%t [%p-%l] %q%u@%d '
log_timezone = 'PRC'
stats_temp_directory = '/var/run/postgresql/9.4-main.pg_stat_tmp'
datestyle = 'iso, mdy'
timezone = 'PRC'
lc_messages = 'en_US.UTF-8'
lc_monetary = 'en_US.UTF-8'
lc_numeric = 'en_US.UTF-8'
lc_time = 'en_US.UTF-8'
default_text_search_config = 'pg_catalog.english'
log_min_duration_statement = 500
```
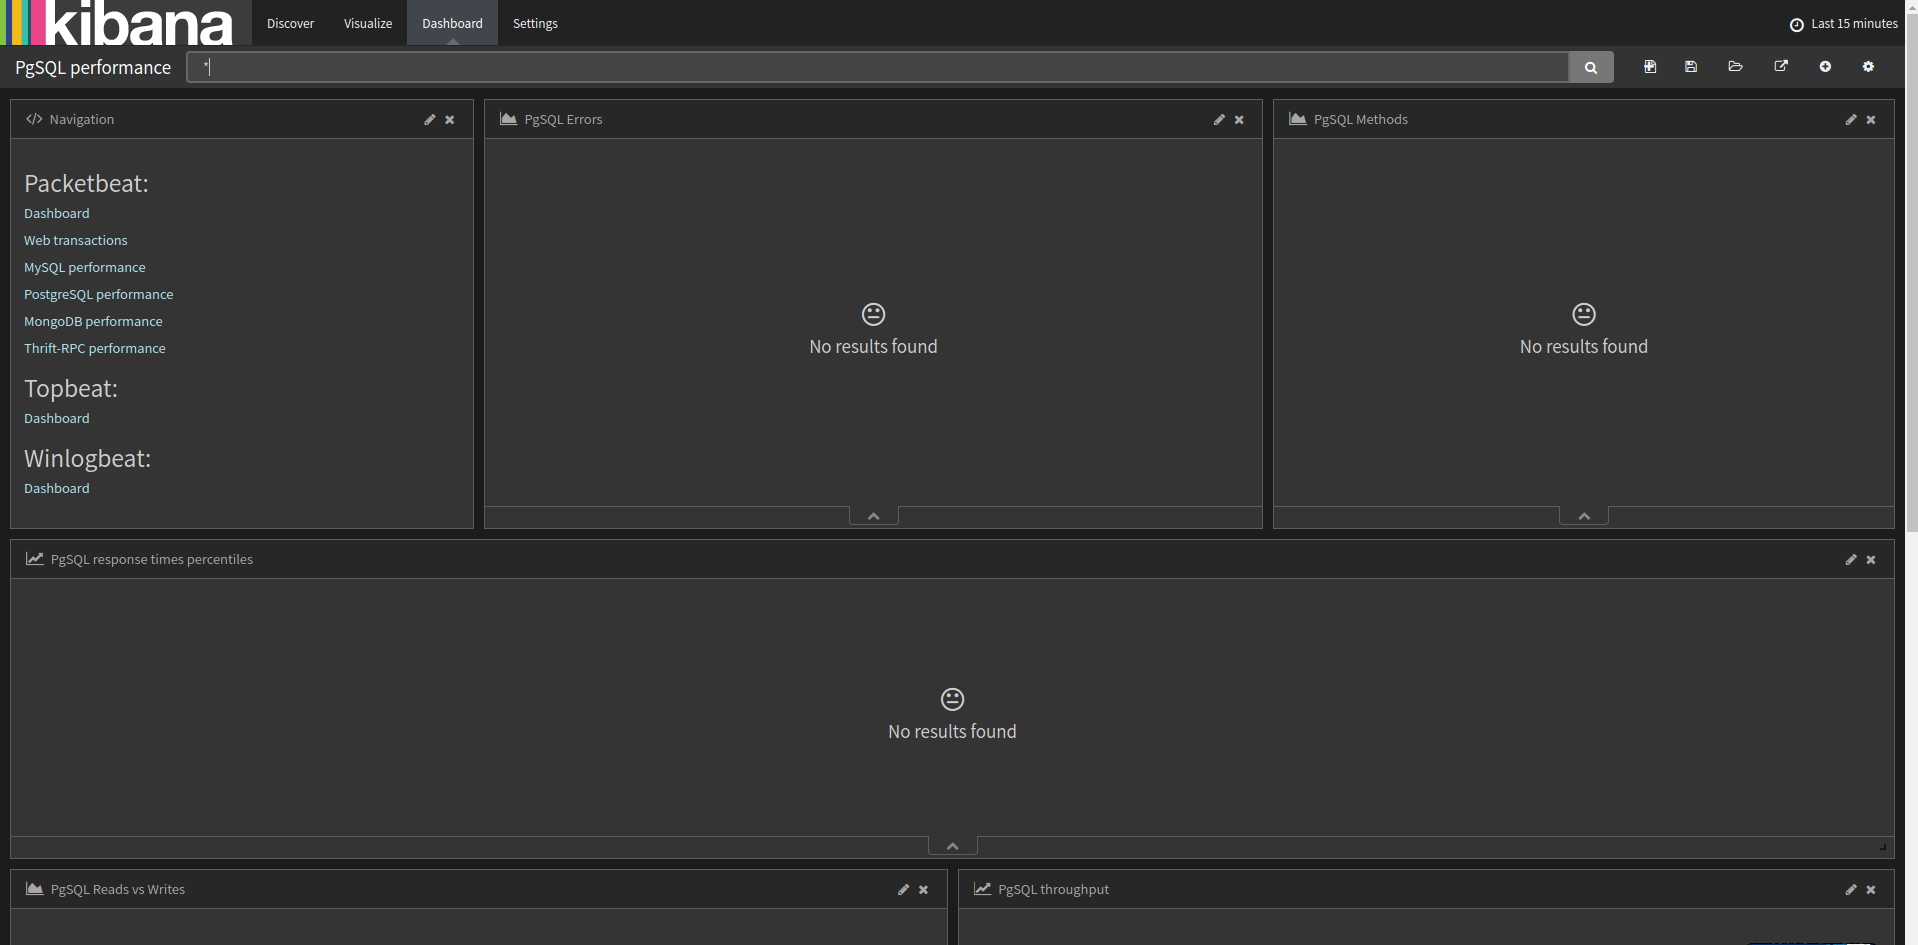
But kibana cannot show any PostgreSQL performance, but mongodb works.

---
### Author:  [@steffens](https://discuss.elastic.co/u/steffens)
#### Post date: [March 4, 2016, 11:53am UTC](https://discuss.elastic.co/t/unable-to-get-postgresql-performance-in-packetbeat/43477/2 "2016-03-04T11:53:50Z")
How do clients connect to postgres? unix-socket, TCP or TCP+SSL? Packetbeat is a passive network sniffer and therefore requires plain TCP.
---
### Author:  [@abcfy2](https://discuss.elastic.co/u/abcfy2)
#### Post date: [March 4, 2016, 12:01pm UTC](https://discuss.elastic.co/t/unable-to-get-postgresql-performance-in-packetbeat/43477/3 "2016-03-04T12:01:36Z")
Both TCP and unix-socket. Maybe ssl is enabled, because `ssl = true` in `postgresql.conf`.
---
### Author:  [@steffens](https://discuss.elastic.co/u/steffens)
#### Post date: [March 4, 2016, 12:08pm UTC](https://discuss.elastic.co/t/unable-to-get-postgresql-performance-in-packetbeat/43477/4 "2016-03-04T12:08:05Z")
SSL will be a problem.
Maybe you can try with postgres client to connect via plain TCP (e.g. check with wireshark/tshark/tcpdump it's really plain TCP) and see problem persists. For sniffing unix-sockets or SSL one basically needs some kind of proxy, which packetbeat is not.
---
### Author:  [@abcfy2](https://discuss.elastic.co/u/abcfy2)
#### Post date: [March 4, 2016, 12:28pm UTC](https://discuss.elastic.co/t/unable-to-get-postgresql-performance-in-packetbeat/43477/5 "2016-03-04T12:28:10Z")
I've delete the 3 lines about ssl, but kibana also show nothing about postgresql.
```auto
show all;
ssl | off | Enables SSL connections.
ssl_ca_file | | Location of the SSL certificate authority file.
ssl_cert_file | server.crt | Location of the SSL server certificate file.
ssl_ciphers | HIGH:MEDIUM:+3DES:!aNULL | Sets the list of allowed SSL ciphers.
ssl_crl_file | | Location of the SSL certificate revocation list file.
ssl_ecdh_curve | prime256v1 | Sets the curve to use for ECDH.
ssl_key_file | server.key | Location of the SSL server private key file.
ssl_prefer_server_ciphers | on | Give priority to server ciphersuite order.
ssl_renegotiation_limit | 0 | Set the amount of traffic to send and receive before renegotiating the encryption keys.
```
I've turned off `ssl`, but this issue still persists.
---
### Author:  [@steffens](https://discuss.elastic.co/u/steffens)
#### Post date: [March 4, 2016, 1:02pm UTC](https://discuss.elastic.co/t/unable-to-get-postgresql-performance-in-packetbeat/43477/6 "2016-03-04T13:02:23Z")
can you check with tshark/wireshark if you can sniff any traffic?
---
### Author:  [@abcfy2](https://discuss.elastic.co/u/abcfy2)
#### Post date: [March 4, 2016, 1:42pm UTC](https://discuss.elastic.co/t/unable-to-get-postgresql-performance-in-packetbeat/43477/7 "2016-03-04T13:42:31Z")
How to use? Use which command? I have no GUI on my server, just use SSH.
---
### Author:  [@steffens](https://discuss.elastic.co/u/steffens)
#### Post date: [March 4, 2016, 2:45pm UTC](https://discuss.elastic.co/t/unable-to-get-postgresql-performance-in-packetbeat/43477/8 "2016-03-04T14:45:28Z")
without gui you can use tcpdump or tshark to check network packets being available. With tcpdump you can also write packets to file and insepect file from within wireshark.
---
### Author:  [@abcfy2](https://discuss.elastic.co/u/abcfy2)
#### Post date: [March 5, 2016, 4:58am UTC](https://discuss.elastic.co/t/unable-to-get-postgresql-performance-in-packetbeat/43477/9 "2016-03-05T04:58:11Z")
I find this [post](https://github.com/elastic/beats/issues/123)
By using this command:
```auto
tcpdump -i any -s0 -w"trace.pcap" "port 5432"
```
Here is the [`trace.pcap`](http://7xjpgb.com1.z0.glb.clouddn.com/trace.pcap), but I can't read it.
---
### Author:  [@steffens](https://discuss.elastic.co/u/steffens)
#### Post date: [March 5, 2016, 11:49pm UTC](https://discuss.elastic.co/t/unable-to-get-postgresql-performance-in-packetbeat/43477/10 "2016-03-05T23:49:28Z")
you can inspect the pcap in wireshark.
running pcap with packetbeat test mode:
```
./packetbeat -e -c packetbeat.yml -N -I ~/Downloads/trace-2.pcap -t -v -d 'publish'
```
I get some events, for example:
```auto
{
"@timestamp": "2016-03-05T04:56:14.776Z",
"beat": {
"hostname": "Steffens-MBP.fritz.box",
"name": "Steffens-MBP.fritz.box"
},
"bytes_in": 52,
"bytes_out": 60,
"client_ip": "127.0.0.1",
"client_port": 50605,
"client_proc": "",
"client_server": "Steffens-MBP.fritz.box",
"count": 1,
"ip": "127.0.0.1",
"method": "SELECT",
"pgsql": {
"error_code": "",
"error_message": "",
"error_severity": "",
"iserror": false,
"num_fields": 1,
"num_rows": 1
},
"port": 5432,
"proc": "",
"query": "SELECT 1",
"responsetime": 0,
"server": "Steffens-MBP.fritz.box",
"status": "OK",
"type": "pgsql"
}
```
Please run packetbeat in debug mode `-v -d '*'` and share log output + config. Sniffing and decoding seems to work.
---
### Author:  [@abcfy2](https://discuss.elastic.co/u/abcfy2)
#### Post date: [March 6, 2016, 5:49am UTC](https://discuss.elastic.co/t/unable-to-get-postgresql-performance-in-packetbeat/43477/11 "2016-03-06T05:49:03Z")
Thanks
```auto
packetbeat -e -c packetbeat.yml -N -I trace.pcap -t -v -d '*'
```
And here is the [log](http://7xjpgb.com1.z0.glb.clouddn.com/packetbeat.log.xz).
I'm not changing the default config of packetbeat.
---
### Author:  [@steffens](https://discuss.elastic.co/u/steffens)
#### Post date: [March 6, 2016, 8:08pm UTC](https://discuss.elastic.co/t/unable-to-get-postgresql-performance-in-packetbeat/43477/12 "2016-03-06T20:08:57Z")
Weird, I'm missing the pgsql events in your logs. Can you run:
```
packetbeat -e -c packetbeat.yml -N -I ~/Downloads/trace-2.pcap -t -v -d 'publish'
```
Also run `packetbeat -e -c packetbeat.yml -v -d '*'` to sniff packets from network.
---
### Author:  [@abcfy2](https://discuss.elastic.co/u/abcfy2)
#### Post date: [March 7, 2016, 1:49am UTC](https://discuss.elastic.co/t/unable-to-get-postgresql-performance-in-packetbeat/43477/13 "2016-03-07T01:49:38Z")
```auto
# packetbeat -e -c /etc/packetbeat/packetbeat.yml -N -I trace.pcap -t -v -d 'publish'
2016/03/07 01:36:11.285284 publish.go:202: INFO Dry run mode. All output types except the file based one are disabled.
2016/03/07 01:36:11.285588 geolite.go:24: INFO GeoIP disabled: No paths were set under output.geoip.paths
2016/03/07 01:36:11.285768 publish.go:288: INFO Publisher name: shifudaotest
2016/03/07 01:36:11.286225 beat.go:147: INFO Init Beat: packetbeat; Version: 1.1.1
2016/03/07 01:36:11.288703 beat.go:173: INFO packetbeat sucessfully setup. Start running.
2016/03/07 01:36:11.290527 pgsql.go:875: WARN Response from unknown transaction. Ignoring.
2016/03/07 01:36:11.290626 pgsql.go:875: WARN Response from unknown transaction. Ignoring.
2016/03/07 01:36:11.290676 pgsql.go:875: WARN Response from unknown transaction. Ignoring.
2016/03/07 01:36:11.290736 pgsql.go:875: WARN Response from unknown transaction. Ignoring.
2016/03/07 01:36:11.293602 pgsql.go:374: WARN Postgresql Message too short. 58 (length=1). Wait for more.
2016/03/07 01:36:11.293662 pgsql.go:374: WARN Postgresql Message too short. 58 (length=1). Wait for more.
2016/03/07 01:36:11.309933 pgsql.go:875: WARN Response from unknown transaction. Ignoring.
2016/03/07 01:36:11.323170 pgsql.go:875: WARN Response from unknown transaction. Ignoring.
2016/03/07 01:36:11.323249 pgsql.go:875: WARN Response from unknown transaction. Ignoring.
2016/03/07 01:36:11.323283 pgsql.go:875: WARN Response from unknown transaction. Ignoring.
2016/03/07 01:36:11.323315 pgsql.go:875: WARN Response from unknown transaction. Ignoring.
2016/03/07 01:36:11.630358 sniffer.go:359: INFO Input finish. Processed 5444 packets. Have a nice day!
```
And [here](http://7xjpgb.com1.z0.glb.clouddn.com/packetbeat.log.xz) is the log of `packetbeat -e -c packetbeat.yml -v -d '*'`.
But in the `trace.pacp` file, I could see the express SQL and fields.
---
### Author:  [@steffens](https://discuss.elastic.co/u/steffens)
#### Post date: [March 18, 2016, 1:21pm UTC](https://discuss.elastic.co/t/unable-to-get-postgresql-performance-in-packetbeat/43477/14 "2016-03-18T13:21:49Z")
Hmm... interesting. I tested with current packetbeat development branch. There are some improvements to the pgsql module.
Can you try with nightly builds? [https://beats-nightlies.s3.amazonaws.com/index.html?prefix=packetbeat/](https://beats-nightlies.s3.amazonaws.com/index.html?prefix=packetbeat/)
---
### Author:  [@system](https://discuss.elastic.co/u/system)
#### Post date: [July 5, 2017, 9:54pm UTC](https://discuss.elastic.co/t/unable-to-get-postgresql-performance-in-packetbeat/43477/15 "2017-07-05T21:54:30Z")