# Visual Builder Top N not matching Data Table for same query
**URL:** https://discuss.elastic.co/t/visual-builder-top-n-not-matching-data-table-for-same-query/101093
**Category:** Kibana
**Created:** [September 20, 2017, 3:15am UTC](https://discuss.elastic.co/t/visual-builder-top-n-not-matching-data-table-for-same-query/101093 "2017-09-20T03:15:49Z")
**Posts on this page:** 8
**Page:** 1
### Author:  [@Terry\_C](https://discuss.elastic.co/u/Terry_C)
#### Post date: [September 20, 2017, 3:15am UTC](https://discuss.elastic.co/t/visual-builder-top-n-not-matching-data-table-for-same-query/101093/1 "2017-09-20T03:15:49Z")
Hello,
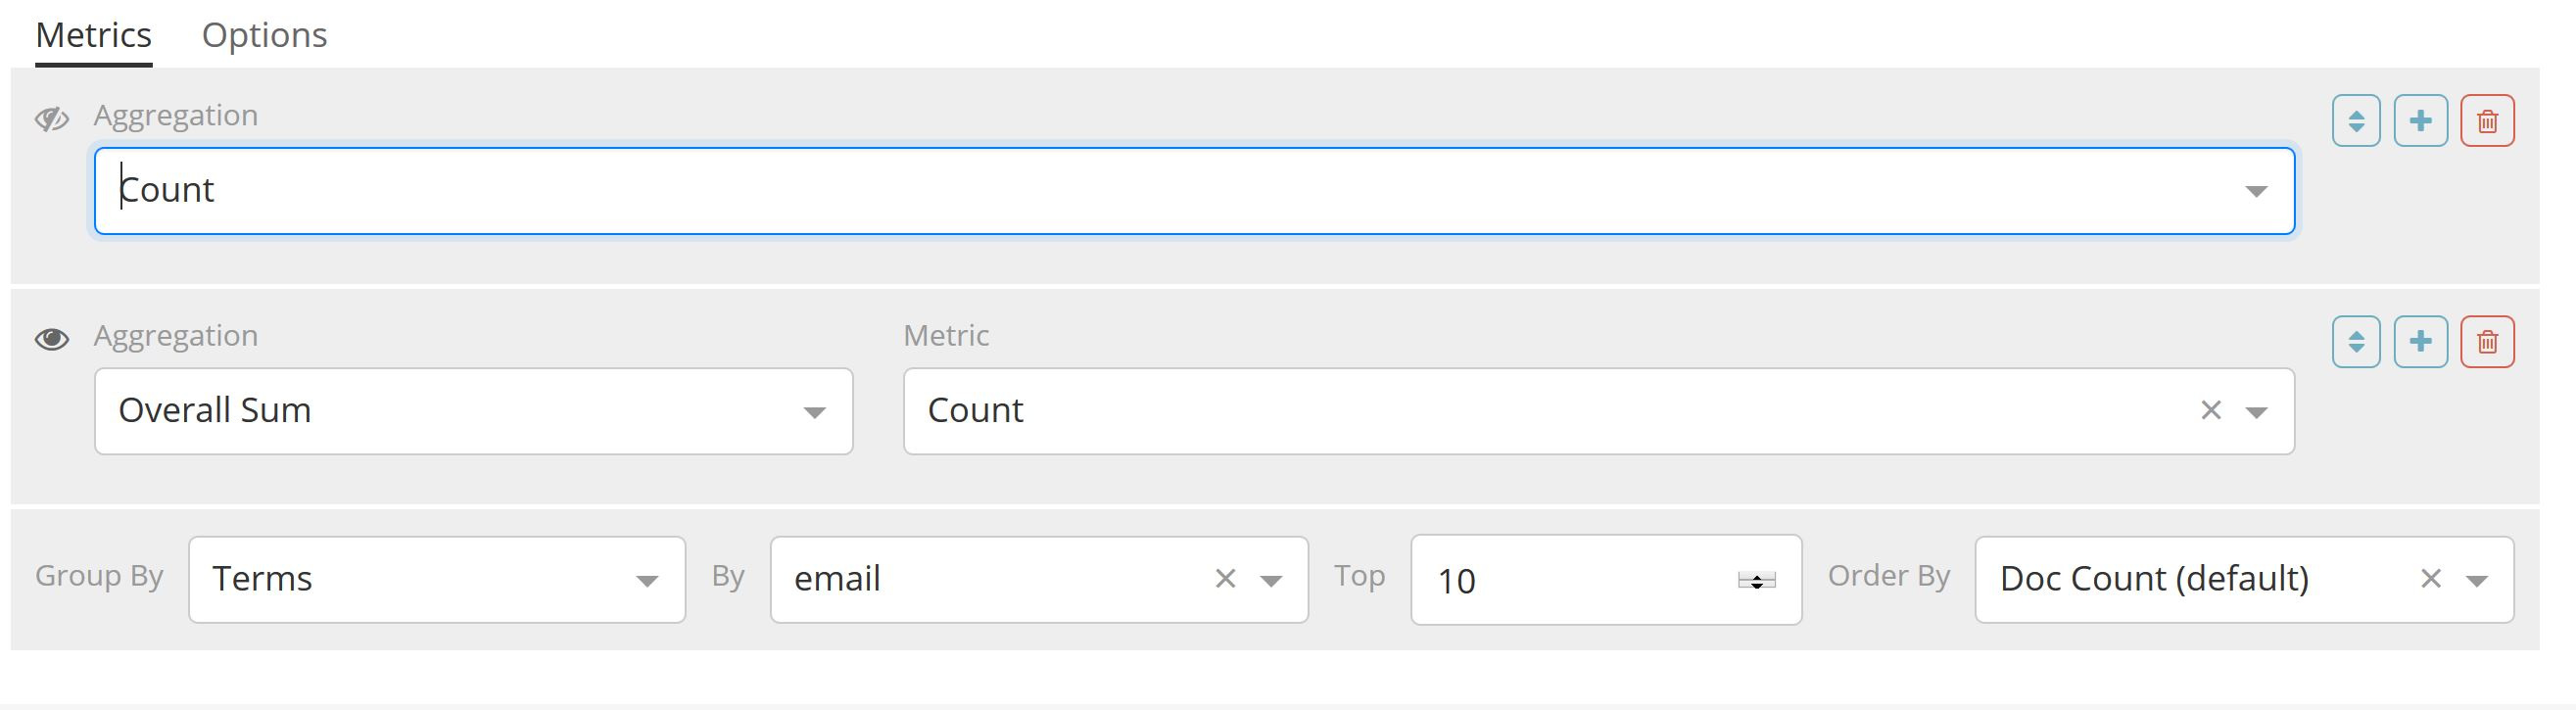
I have a data table with the Top 10 callers based on the data I have and want to convert it to use the Top N in the Timer Series Visual Builder as it has a nicer visualization. I'm finding that the Top N doesn't give the same results as the Data Table sorted in descending order. I'm pasting the data table query and the Top N query I used. I believe I converted it properly. Can someone tell me what might be wrong?
I pasted the same query filter I used in Data Table into the Panel Filter in Visual Builder. The interval is set to auto; ignore global filter=yes, drop last bucket=yes/no (doesn't make a difference).
I verified that the Data Table results are correct by using Discovery and using the same query filter.

This is the Top N setup:
I'm using ES 5.6.1 and Kibana 5.6.1.
---
### Author:  [@tsullivan](https://discuss.elastic.co/u/tsullivan)
#### Post date: [September 20, 2017, 6:46pm UTC](https://discuss.elastic.co/t/visual-builder-top-n-not-matching-data-table-for-same-query/101093/2 "2017-09-20T18:46:08Z")
One thing to check for: note that TSVB doesn't use index patterns but the Data Table viz does, so the query that it's using may be looking at more data than the Data Table does.
---
### Author:  [@Terry\_C](https://discuss.elastic.co/u/Terry_C)
#### Post date: [September 20, 2017, 8:45pm UTC](https://discuss.elastic.co/t/visual-builder-top-n-not-matching-data-table-for-same-query/101093/3 "2017-09-20T20:45:25Z")
Hi Tim,
Thanks for the response.
I do have the correct index pattern specified in the Panel Options in TSVB. Also, this is query for counting matching records and the Data Table shows a higher count for some rows than visual builder (some rows match). Discovery tab query matches the Data Table query results.
If I converted the Data Table correctly to TSVB Top N above, are there any other reasons this may not give the same results? Are there any known issues with this and TSVB Top N?
---
### Author:  [@tsullivan](https://discuss.elastic.co/u/tsullivan)
#### Post date: [September 20, 2017, 10:02pm UTC](https://discuss.elastic.co/t/visual-builder-top-n-not-matching-data-table-for-same-query/101093/4 "2017-09-20T22:02:39Z")
> [@Terry\_C](#):
>
> ignore global filter=yes
> [@Terry\_C](#):
>
> using the same query filter
If you are using a query filter on the same set of data for both visualization types, then you wouldn't want to set "ignore global filter = yes", am I right?
I set up some data and tried to reproduce what you are seeing. I ran into a bit of temporary confusion but it was cleared up when I realized that I had 2 different browser tabs with my visualizations and the data wasn't refreshed in sync. Other than that, the sorting is a bit weird when terms have the same count because the data isn't secondarily sorted by the term. But otherwise it looks fine.
So my recommendation is to check to see if your visualizations are up to sync with the latest data.
---
### Author:  [@Terry\_C](https://discuss.elastic.co/u/Terry_C)
#### Post date: [September 21, 2017, 1:41pm UTC](https://discuss.elastic.co/t/visual-builder-top-n-not-matching-data-table-for-same-query/101093/5 "2017-09-21T13:41:40Z")
Hi Tim,
Thanks for the response. What I meant by the same filter is that I typed the same filter in the Panel options, but it doesn't make a difference whether you toggle it the radio button for Global Filter and use the global filter or type it in the panel.
I checked carefully to see that the time frames matched in the query and refreshed several times. As I had mentioned, some rows have the correct count, but others are lower than what it should be compared to the Data Table and Discovery results.
I also tried Cumulative Sum instead of Overall Sum because one of the other posts showed that for counting similar to the problem I had, but the results were the same. What is the correct aggregation to use for my use case: cumulative sum or overall sum?
At any rate, any other ideas on how I can try to match them up to the correct count?
---
### Author:  [@tsullivan](https://discuss.elastic.co/u/tsullivan)
#### Post date: [September 21, 2017, 5:14pm UTC](https://discuss.elastic.co/t/visual-builder-top-n-not-matching-data-table-for-same-query/101093/6 "2017-09-21T17:14:54Z")
> [@Terry\_C](#):
>
> one of the other posts showed that for counting similar to the problem I had
Can you link the other topic(s) you referenced?
---
### Author:  [@tsullivan](https://discuss.elastic.co/u/tsullivan)
#### Post date: [October 13, 2017, 11:10pm UTC](https://discuss.elastic.co/t/visual-builder-top-n-not-matching-data-table-for-same-query/101093/7 "2017-10-13T23:10:33Z")
I saw a new issue has been filed on TSVB and the Top N visualization: [https://github.com/elastic/kibana/issues/14453](https://github.com/elastic/kibana/issues/14453)
Take a look at the issue, it could explain why you are not seeing what you expect.
---
### Author:  [@system](https://discuss.elastic.co/u/system)
#### Post date: [November 10, 2017, 11:10pm UTC](https://discuss.elastic.co/t/visual-builder-top-n-not-matching-data-table-for-same-query/101093/8 "2017-11-10T23:10:40Z")
This topic was automatically closed 28 days after the last reply. New replies are no longer allowed.