# We cannot see APM trace sample Timelines
**URL:** https://discuss.elastic.co/t/we-cannot-see-apm-trace-sample-timelines/339792
**Category:** APM
**Tags:** ui
**Created:** [August 1, 2023, 11:40am UTC](https://discuss.elastic.co/t/we-cannot-see-apm-trace-sample-timelines/339792 "2023-08-01T11:40:21Z")
**Posts on this page:** 4
**Page:** 1
### Author:  [@mmartinez](https://discuss.elastic.co/u/mmartinez)
#### Post date: [August 1, 2023, 11:40am UTC](https://discuss.elastic.co/t/we-cannot-see-apm-trace-sample-timelines/339792/1 "2023-08-01T11:40:22Z")
escloud version: 8.7.0
Browser version: Chrome
We cannot see the trace sample timelines in our production development but we can see them in the staging development.
In prod we use spaces and in staging we don't use them.
This is an example of an APM trace sample timeline in staging:

This is an example in prod:
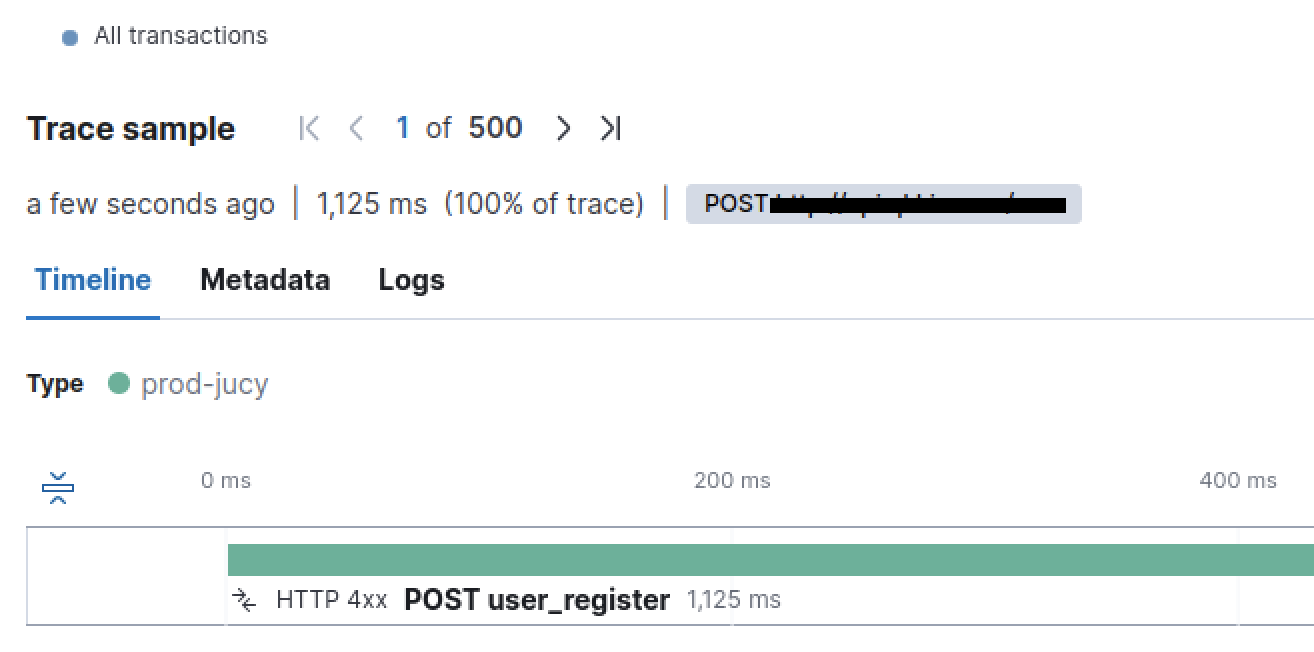
We haven't done any changes lately
Does anybody have a clue about what could be happening? Thanks in advance and let me know if you need more info.
mario
---
### Author:  [@mmartinez](https://discuss.elastic.co/u/mmartinez)
#### Post date: [August 2, 2023, 9:48am UTC](https://discuss.elastic.co/t/we-cannot-see-apm-trace-sample-timelines/339792/2 "2023-08-02T09:48:41Z")
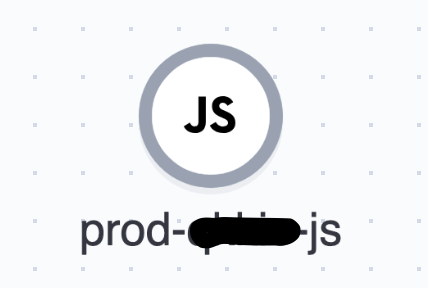
In the APM Service map, we can see that staging shows different resources and in prod, it doesn't show any. I attach the examples.
PROD:
STAGING:

But for example, if I check the Time spent by span type metric in PROD then it shows there are more than only one:

Regards
---
### Author:  [@mmartinez](https://discuss.elastic.co/u/mmartinez)
#### Post date: [August 3, 2023, 1:32pm UTC](https://discuss.elastic.co/t/we-cannot-see-apm-trace-sample-timelines/339792/3 "2023-08-03T13:32:33Z")
Found the problem!
There was a problem with a runtime field in the apm pipelines that fixed the problem
---
### Author:  [@system](https://discuss.elastic.co/u/system)
#### Post date: [August 31, 2023, 1:32pm UTC](https://discuss.elastic.co/t/we-cannot-see-apm-trace-sample-timelines/339792/4 "2023-08-31T13:32:41Z")
This topic was automatically closed 28 days after the last reply. New replies are no longer allowed.