### Author:  [@Dominik\_Raute](https://discuss.elastic.co/u/Dominik_Raute)
#### Post date: [May 5, 2017, 1:52pm UTC](https://discuss.elastic.co/t/what-could-make-a-healthy-es5-3-1-cluster-go-oom-unresponsive-instantly/84730/1 "2017-05-05T13:52:05Z")
Does anybody here have a clue what could make a well-dimensioned (3x28G/8C) production ES 5.3 cluster that's completely happily chugging along for hours at maybe 20% load (50/50 mix of indexing and mixed queries, classic search use) INSTANTLY freeze to death and go unresponsive due to GC?
No forewarning, usual slow heap contractions (down to 20%) and low cpu/load until right before this happens - and then between two 1min monitoring intervals, the cluster literally goes off the radar like MH370. We don't even get heap size warnings or cluster health alerts anymore as the whole Elastic API doesn't answer anymore, it's that quick. On the nodes themselves you just see 100% heap and 100% CPU (GC) in htop.
No smoking guns in the logs (except lots of unrelated OOM errors), no slow queries, no spike in either query amount or indexing. All the classics ("Six ways to Crash ElasticSearch") can be pretty much excluded. And the cluster recovers by itself around 30-60mins later.
I'm totally stumped and investigating since three days, maybe someone here has an insight...
---
### Author:  [@jasontedor](https://discuss.elastic.co/u/jasontedor)
#### Post date: [May 5, 2017, 4:50pm UTC](https://discuss.elastic.co/t/what-could-make-a-healthy-es5-3-1-cluster-go-oom-unresponsive-instantly/84730/2 "2017-05-05T16:50:59Z")
Do you have a stack trace in the logs from when it killed itself on the OOM?
---
### Author:  [@Dominik\_Raute](https://discuss.elastic.co/u/Dominik_Raute)
#### Post date: [May 5, 2017, 5:21pm UTC](https://discuss.elastic.co/t/what-could-make-a-healthy-es5-3-1-cluster-go-oom-unresponsive-instantly/84730/3 "2017-05-05T17:21:36Z")
We do, but they didn't feel too helpful (also, every time it crashed, they looked slightly different, I guess it was mostly side threads running into OOM), anyway, here's one from the last recent crash:
```auto
[2017-05-05T05:57:40,535][DEBUG][o.e.a.a.c.h.TransportClusterHealthAction] [prod-es53-1] no known master node, scheduling a retry
[2017-05-05T05:57:50,550][DEBUG][o.e.a.a.c.h.TransportClusterHealthAction] [prod-es53-1] timed out while retrying [cluster:monitor/health] after failure (timeout [30s])
[2017-05-05T05:57:50,551][WARN][r.suppressed] path: /_cluster/health, params: {}
org.elasticsearch.discovery.MasterNotDiscoveredException: null
```
```auto
prod-es53-1 / 10.132.8.6
[2017-05-05T05:31:11,604][ERROR][o.e.b.ElasticsearchUncaughtExceptionHandler] [prod-es53-1] fatal error in thread [elasticsearch[prod-es53-1][search][T#6]], exiting
java.lang.OutOfMemoryError: Java heap space
[2017-05-05T05:31:51,639][INFO][o.e.m.j.JvmGcMonitorService] [prod-es53-1] [gc][young][21278][24996] duration [875ms], collections [1]/[1s], total [875ms]/[13.5m], memory [17gb]->[17.6gb]/[17.9gb], all_pools {[young] [140.9mb]->[333.3mb]/[532.5mb]}{[survivor] [66.4mb]->[66.4mb]/[66.5mb]}{[old] [16.8gb]->[17.2gb]/[17.3gb]}
--
[2017-05-05T05:31:09,499][ERROR][o.e.b.ElasticsearchUncaughtExceptionHandler] [prod-es53-1] fatal error in thread [elasticsearch[prod-es53-1][search][T#12]], exiting
java.lang.OutOfMemoryError: Java heap space
at org.apache.lucene.codecs.blocktree.SegmentTermsEnumFrame.(SegmentTermsEnumFrame.java:92) ~[lucene-core-6.4.2.jar:6.4.2 34a975ca3d4bd7fa121340e5bcbf165929e0542f - ishan - 2017-03-01 23:23:13]
---
prod-es53-2 / 10.132.8.7
[2017-05-05T05:42:35,097][WARN][i.n.c.n.NioEventLoop] Unexpected exception in the selector loop.
java.lang.OutOfMemoryError: Java heap space
[2017-05-05T06:01:19,259][ERROR][o.e.t.n.Netty4Utils] fatal error on the network layer
--
[2017-05-05T06:01:20,276][ERROR][o.e.b.ElasticsearchUncaughtExceptionHandler] [prod-es53-2] fatal error in thread [Thread-3672], exiting
java.lang.OutOfMemoryError: Java heap space
[2017-05-05T06:01:20,288][WARN][i.n.c.AbstractChannelHandlerContext] An exception 'java.lang.OutOfMemoryError: Java heap space' [enable DEBUG level for full stacktrace] was thrown by a user handler's exceptionCaught() method while handling the following exception:
java.lang.OutOfMemoryError: Java heap space
at java.nio.ByteBuffer.wrap(ByteBuffer.java:373) ~[?:1.8.0_121]
--
[2017-05-05T06:01:20,288][ERROR][o.e.b.ElasticsearchUncaughtExceptionHandler] [prod-es53-2] fatal error in thread [Thread-3669], exiting
java.lang.OutOfMemoryError: Java heap space
at java.nio.ByteBuffer.wrap(ByteBuffer.java:373) ~[?:1.8.0_121]
---
prod-es53-3 / 10.132.8.8
[2017-05-05T06:04:34,439][ERROR][o.e.b.ElasticsearchUncaughtExceptionHandler] [prod-es53-3] fatal error in thread [elasticsearch[prod-es53-3][search][T#7]], exiting
java.lang.OutOfMemoryError: Java heap space
at org.apache.lucene.search.similarities.BM25Similarity.computeWeight(BM25Similarity.java:214) ~[lucene-core-6.4.2.jar:6.4.2 34a975ca3d4bd7fa121340e5bcbf165929e0542f - ishan - 2017-03-01 23:23:13]
--
[2017-05-05T06:05:19,193][ERROR][o.e.b.ElasticsearchUncaughtExceptionHandler] [prod-es53-3] fatal error in thread [elasticsearch[prod-es53-3][search][T#8]], exiting
java.lang.OutOfMemoryError: Java heap space
[2017-05-05T06:05:39,332][INFO][o.e.n.Node] [prod-es53-3] initializing ...
```
---
### Author:  [@jasontedor](https://discuss.elastic.co/u/jasontedor)
#### Post date: [May 6, 2017, 2:08am UTC](https://discuss.elastic.co/t/what-could-make-a-healthy-es5-3-1-cluster-go-oom-unresponsive-instantly/84730/4 "2017-05-06T02:08:33Z")
> [@Dominik\_Raute](#):
>
> [2017-05-05T06:01:20,288][ERROR][o.e.b.ElasticsearchUncaughtExceptionHandler] [prod-es53-2] fatal error in thread [Thread-3669]
This is extremely suspicious. We do not create threads with generic names like that, and the fact that the counter is so high is troubling. Do you have a plugin installed that would be creating threads like this, are they leaking? Can you show more of _that_ stack trace? Can you show what plugins you have installed?
---
### Author:  [@Dominik\_Raute](https://discuss.elastic.co/u/Dominik_Raute)
#### Post date: [May 6, 2017, 6:46am UTC](https://discuss.elastic.co/t/what-could-make-a-healthy-es5-3-1-cluster-go-oom-unresponsive-instantly/84730/5 "2017-05-06T06:46:26Z")
Hi Jason,
thanks so much for giving a hot lead here.
As for the plugins themselves, where could I find their logs & stacktraces?
Only thing I could find was
```auto
echo "Installing plugins ..."
sudo /usr/share/elasticsearch/bin/elasticsearch-plugin install --batch repository-s3
sudo /usr/share/elasticsearch/bin/elasticsearch-plugin install --batch repository-gcs
```
I just realized we still have both plugins inside (we recently migrated from AWS to GCP... could it be that they somehow conflict?
Cheers,
Dominik
---
### Author:  [@jasontedor](https://discuss.elastic.co/u/jasontedor)
#### Post date: [May 6, 2017, 2:17pm UTC](https://discuss.elastic.co/t/what-could-make-a-healthy-es5-3-1-cluster-go-oom-unresponsive-instantly/84730/6 "2017-05-06T14:17:21Z")
The stack trace for the specific log line that I called out should be immediately below that log line in the main Elasticsearch log.
If those are the only plugins that you have installed, I do not think they do anything offensive in this regard. The only other source I can think of for a thread with such a generic name would be within Netty, the framework that we use for a our networking layer. A stack trace would help clarify this either way.
Another thing I notice about your situation is that most of the fatal OOMs are happening on search threads. This is usually (but not always) indicative of heavy search requests that overwhelm a cluster. What sorts of queries are you running, any heavy aggregations? When a node shoots itself, it should drop a heap dump in the working directory first. Do you have one?
---
### Author:  [@jasontedor](https://discuss.elastic.co/u/jasontedor)
#### Post date: [May 6, 2017, 4:41pm UTC](https://discuss.elastic.co/t/what-could-make-a-healthy-es5-3-1-cluster-go-oom-unresponsive-instantly/84730/7 "2017-05-06T16:41:46Z")
I looked, I do not think these threads are coming from Netty. We really need a stack trace here.
---
### Author:  [@Dominik\_Raute](https://discuss.elastic.co/u/Dominik_Raute)
#### Post date: [May 6, 2017, 6:55pm UTC](https://discuss.elastic.co/t/what-could-make-a-healthy-es5-3-1-cluster-go-oom-unresponsive-instantly/84730/8 "2017-05-06T18:55:32Z")
Hi Jason,
stack trace is here (well, looks like Netty?):
```auto
[2017-05-05T06:01:20,276][ERROR][o.e.b.ElasticsearchUncaughtExceptionHandler] [prod-es53-2] fatal error in thread [Thread-3672], exiting
java.lang.OutOfMemoryError: Java heap space
[2017-05-05T06:01:20,288][WARN][i.n.c.AbstractChannelHandlerContext] An exception 'java.lang.OutOfMemoryError: Java heap space' [enable DEBUG level for full stacktrace] was thrown by a user handler's exceptionCaught() method while handling the following exception:
java.lang.OutOfMemoryError: Java heap space
at java.nio.ByteBuffer.wrap(ByteBuffer.java:373) ~[?:1.8.0_121]
at java.nio.ByteBuffer.wrap(ByteBuffer.java:396) ~[?:1.8.0_121]
at io.netty.buffer.PooledHeapByteBuf.newInternalNioBuffer(PooledHeapByteBuf.java:339) ~[netty-buffer-4.1.7.Final.jar:4.1.7.Final]
at io.netty.buffer.PooledHeapByteBuf.newInternalNioBuffer(PooledHeapByteBuf.java:29) ~[netty-buffer-4.1.7.Final.jar:4.1.7.Final]
at io.netty.buffer.PooledByteBuf.internalNioBuffer(PooledByteBuf.java:158) ~[netty-buffer-4.1.7.Final.jar:4.1.7.Final]
at io.netty.buffer.PooledHeapByteBuf.setBytes(PooledHeapByteBuf.java:261) ~[netty-buffer-4.1.7.Final.jar:4.1.7.Final]
at io.netty.buffer.AbstractByteBuf.writeBytes(AbstractByteBuf.java:1100) ~[netty-buffer-4.1.7.Final.jar:4.1.7.Final]
at io.netty.channel.socket.nio.NioSocketChannel.doReadBytes(NioSocketChannel.java:366) ~[netty-transport-4.1.7.Final.jar:4.1.7.Final]
at io.netty.channel.nio.AbstractNioByteChannel$NioByteUnsafe.read(AbstractNioByteChannel.java:118) [netty-transport-4.1.7.Final.jar:4.1.7.Final]
at io.netty.channel.nio.NioEventLoop.processSelectedKey(NioEventLoop.java:642) [netty-transport-4.1.7.Final.jar:4.1.7.Final]
at io.netty.channel.nio.NioEventLoop.processSelectedKeysPlain(NioEventLoop.java:527) [netty-transport-4.1.7.Final.jar:4.1.7.Final]
at io.netty.channel.nio.NioEventLoop.processSelectedKeys(NioEventLoop.java:481) [netty-transport-4.1.7.Final.jar:4.1.7.Final]
at io.netty.channel.nio.NioEventLoop.run(NioEventLoop.java:441) [netty-transport-4.1.7.Final.jar:4.1.7.Final]
at io.netty.util.concurrent.SingleThreadEventExecutor$5.run(SingleThreadEventExecutor.java:858) [netty-common-4.1.7.Final.jar:4.1.7.Final]
at java.lang.Thread.run(Thread.java:745) [?:1.8.0_121]
[2017-05-05T06:01:20,288][ERROR][o.e.b.ElasticsearchUncaughtExceptionHandler] [prod-es53-2] fatal error in thread [Thread-3669], exiting
java.lang.OutOfMemoryError: Java heap space
at java.nio.ByteBuffer.wrap(ByteBuffer.java:373) ~[?:1.8.0_121]
at java.nio.ByteBuffer.wrap(ByteBuffer.java:396) ~[?:1.8.0_121]
at io.netty.buffer.PooledHeapByteBuf.newInternalNioBuffer(PooledHeapByteBuf.java:339) ~[?:?]
at io.netty.buffer.PooledHeapByteBuf.newInternalNioBuffer(PooledHeapByteBuf.java:29) ~[?:?]
at io.netty.buffer.PooledByteBuf.internalNioBuffer(PooledByteBuf.java:158) ~[?:?]
at io.netty.buffer.PooledHeapByteBuf.setBytes(PooledHeapByteBuf.java:261) ~[?:?]
at io.netty.buffer.AbstractByteBuf.writeBytes(AbstractByteBuf.java:1100) ~[?:?]
at io.netty.channel.socket.nio.NioSocketChannel.doReadBytes(NioSocketChannel.java:366) ~[?:?]
at io.netty.channel.nio.AbstractNioByteChannel$NioByteUnsafe.read(AbstractNioByteChannel.java:118) ~[?:?]
at io.netty.channel.nio.NioEventLoop.processSelectedKey(NioEventLoop.java:642) ~[?:?]
at io.netty.channel.nio.NioEventLoop.processSelectedKeysPlain(NioEventLoop.java:527) ~[?:?]
at io.netty.channel.nio.NioEventLoop.processSelectedKeys(NioEventLoop.java:481) ~[?:?]
at io.netty.channel.nio.NioEventLoop.run(NioEventLoop.java:441) ~[?:?]
at io.netty.util.concurrent.SingleThreadEventExecutor$5.run(SingleThreadEventExecutor.java:858) ~[?:?]
at java.lang.Thread.run(Thread.java:745) [?:1.8.0_121]
```
Any ideas what that could be?
By the way:
We do all kinds of rather costly aggregations, however we do them all the time and limit deep paging.
I could see an increase in indexing and search queries, but that only happens right _after_ the condition (it's close but noticeable - all kinds of queries piling up and being retried). That's why I think that's not the cause but rather a symptom.
Notice how the monitored CPU didn't even closely reach the 100% it did in reality:

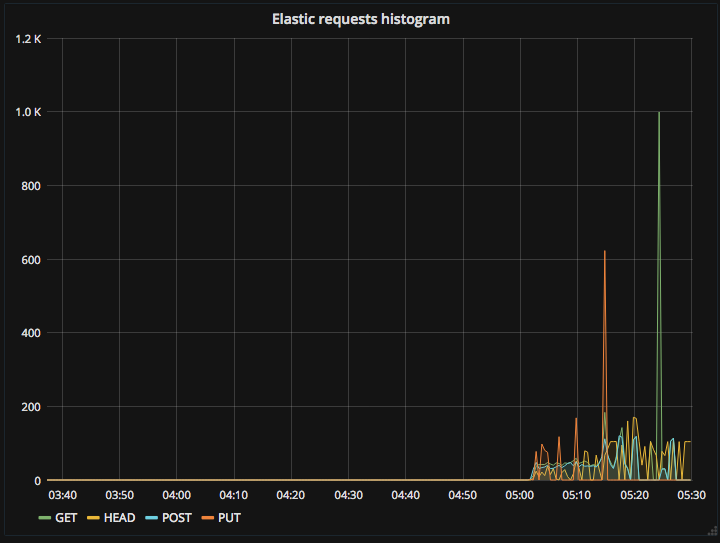
(zoomed in:)


---
### Author:  [@jasontedor](https://discuss.elastic.co/u/jasontedor)
#### Post date: [May 6, 2017, 7:11pm UTC](https://discuss.elastic.co/t/what-could-make-a-healthy-es5-3-1-cluster-go-oom-unresponsive-instantly/84730/9 "2017-05-06T19:11:38Z")
Okay so my hunch that this was Netty is correct, I'll need to look at the code again to see what I missed the first time trying to find this. Having the stack trace helps a lot, thank you.
However, as far as why you're heaping I think we need to see a heap dump, I do think it's going to come down to requests that are hitting your cluster.
---
### Author:  [@Dominik\_Raute](https://discuss.elastic.co/u/Dominik_Raute)
#### Post date: [May 9, 2017, 5:25pm UTC](https://discuss.elastic.co/t/what-could-make-a-healthy-es5-3-1-cluster-go-oom-unresponsive-instantly/84730/10 "2017-05-09T17:25:22Z")
Quick update: The issue seems to be resolved for now. In the end, for lack of better options, we settled for a diverse bunch of possible mitigations we could come up with:
- Configured JVM heap autodump on OOM
- Resized Heap from 65% to 55% of RAM size
- Dialed down all of the memory circuit breakers by around 20%
- Set a general timeout for externally (site user) initiated queries to 30s
- Upgraded to ES5.4
Funnily enough, the cluster has been running like a charm under simulated load since 4 days now and we're back in prod since today ( [https://www.justwatch.com/us/new](https://www.justwatch.com/us/new) in case you're wondering 🙂 )
The only thing that really annoys me is that nobody exactly knows _why_ - it's a little uneasing to not having found the root cause here.
We didn't find any Circuit Breaker or Timeout exceptions in our logs yet.
Anyway, thought I'd let you and the users know.
Thanks for the help so far!
---
### Author:  [@system](https://discuss.elastic.co/u/system)
#### Post date: [June 6, 2017, 5:31pm UTC](https://discuss.elastic.co/t/what-could-make-a-healthy-es5-3-1-cluster-go-oom-unresponsive-instantly/84730/11 "2017-06-06T17:31:07Z")
This topic was automatically closed 28 days after the last reply. New replies are no longer allowed.