# When Watcher HTTP action fails, it reports it fails forever without ever actually retrying
**URL:** https://discuss.elastic.co/t/when-watcher-http-action-fails-it-reports-it-fails-forever-without-ever-actually-retrying/224395
**Category:** Elasticsearch
**Tags:** elastic-stack-alerting
**Created:** [March 20, 2020, 10:04am UTC](https://discuss.elastic.co/t/when-watcher-http-action-fails-it-reports-it-fails-forever-without-ever-actually-retrying/224395 "2020-03-20T10:04:25Z")
**Posts on this page:** 11
**Page:** 1
### Author:  [@runtman](https://discuss.elastic.co/u/runtman)
#### Post date: [March 20, 2020, 10:04am UTC](https://discuss.elastic.co/t/when-watcher-http-action-fails-it-reports-it-fails-forever-without-ever-actually-retrying/224395/1 "2020-03-20T10:04:25Z")
Hello, so I got a watcher action that posts to an API for freshdesk (Ticket system) this works 99.9% of the time, but every now and then we receive a 502 back from Freshdesk.
If this happens, every consequtive alert, will skip the freshdesk part and claim it's failing.
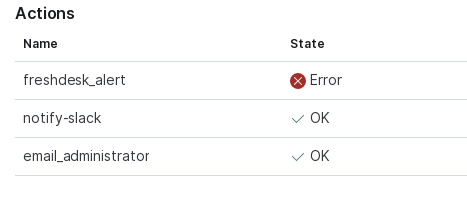

Even on watches that should now report OK report as failing... it's quite annoying.
The only way I appear to fix is is by recreating the watch, am I doing something wrong here? The watcher config is as follows:
```auto
"freshdesk_alert" : {
"webhook" : {
"method" : "POST",
"host" : "X.freshdesk.com",
"path" : "/api/v2/tickets",
"scheme" : "https",
"port" : 443,
"body" : {
"inline": {
"subject": "X",
"description": "X",
"email": "devops@X.com",
"priority": 3,
"status": 2,
"group_id" : 6000196835,
"custom_fields" : {
"customer": "Actual Experience",
"it_or_devops_support_required": "Product Fault/Bug",
"end_customer": "N/A",
"cf_internal_logging_codes_1": "IT Incident",
"cf_internal_logging_codes_2": "Network/Infrastructure",
"cf_internal_logging_codes_3": "Event"
}
}
},
"auth" : {
"basic" : {
"username" : "{{PASSWORDADDEDBYCI}}",
"password" : "X"
}
},
"headers" : {
"Content-Type" : "application/json"
}
}
},
```
---
### Author:  [@spinscale](https://discuss.elastic.co/u/spinscale)
#### Post date: [March 20, 2020, 1:31pm UTC](https://discuss.elastic.co/t/when-watcher-http-action-fails-it-reports-it-fails-forever-without-ever-actually-retrying/224395/2 "2020-03-20T13:31:13Z")
can you share the output of the watcher history index of those failures in a gist/pastebin?
```auto
GET .watcher-history-*/_search
{
"query": {
"bool": {
"filter": [
{
"term": {
"watch_id": "YOUR_WATCH_ID"
}
}
]
}
},
"sort": [
{
"trigger_event.triggered_time": {
"order": "desc"
}
}
]
}
```
This way we could take a closer look of why things keep failing.
Thanks!
---
### Author:  [@runtman](https://discuss.elastic.co/u/runtman)
#### Post date: [March 20, 2020, 2:19pm UTC](https://discuss.elastic.co/t/when-watcher-http-action-fails-it-reports-it-fails-forever-without-ever-actually-retrying/224395/3 "2020-03-20T14:19:46Z")
Hey,
Original Failure:
[https://pastebin.com/6zi9pkkQ](https://pastebin.com/6zi9pkkQ)
Consequitve Watches Listed As Error:
[https://pastebin.com/KQ8hbtje](https://pastebin.com/KQ8hbtje)
Watcher History(This is set to expire in 1 Day):
[https://pastebin.com/FXFKHnYK](https://pastebin.com/FXFKHnYK)
---
### Author:  [@spinscale](https://discuss.elastic.co/u/spinscale)
#### Post date: [March 20, 2020, 3:52pm UTC](https://discuss.elastic.co/t/when-watcher-http-action-fails-it-reports-it-fails-forever-without-ever-actually-retrying/224395/4 "2020-03-20T15:52:27Z")
Hey,
thanks for providing, I think I know why this is happening now, from your first two snippets.
At some point in time your condition was met, the HTTP request was sent and resulted in an error. This error is stored in the watch status at `status.actions.freshdesk_alert.last_execution.successful` - which is `false`, because the last time it got executed, it failed.
The next executions always exited early, because the condition was not met, which left the above status in place - this is why an error is displayed.
Putting the watch again resets the status and thus everything is looking good until this happens again.
The good thing is, that this does not impact the execution of your watch, it just shows different in the UI.
The bad thing is, that this should probably be either fixed in the UI or that the state should be reset once the condition turns false.
Can you open an issue in the Elasticsearch repo with this data and the kibana screenshot? That would be great for the developer to take a look what would be the right thing to do!
Thanks a bunch!
--Alex
---
### Author:  [@runtman](https://discuss.elastic.co/u/runtman)
#### Post date: [March 20, 2020, 4:15pm UTC](https://discuss.elastic.co/t/when-watcher-http-action-fails-it-reports-it-fails-forever-without-ever-actually-retrying/224395/5 "2020-03-20T16:15:57Z")
I will do that now, thank you. Is there a retry mechanism that could be introduced?
---
### Author:  [@runtman](https://discuss.elastic.co/u/runtman)
#### Post date: [March 20, 2020, 4:19pm UTC](https://discuss.elastic.co/t/when-watcher-http-action-fails-it-reports-it-fails-forever-without-ever-actually-retrying/224395/6 "2020-03-20T16:19:33Z")
> [@runtman](#):
>
> Original Failure:
>
> [https://pastebin.com/6zi9pkkQ](https://pastebin.com/6zi9pkkQ)
>
> Consequitve Watches Listed As Error:
>
> [https://pastebin.com/KQ8hbtje](https://pastebin.com/KQ8hbtje)
>
>
> \*\*Elasticsearch version\*\* (\`bin/elasticsearch --version\`): Elastic Cloud 7.6.1
> …
> \*\*Plugins installed\*\*: None
>
> \*\*Description of the problem including expected versus actual behavior\*\*:
>
> Hello, so I got a watcher action that posts to an API for freshdesk (Ticket system) this works 99.9% of the time, but every now and then we receive a 502 back from Freshdesk.
>
> If this happens, every consequtive alert, will skip the freshdesk part and claim it's failing.
>
> !\[1\](https://user-images.githubusercontent.com/6459792/77183511-59bf4e80-6ac6-11ea-834e-16f20b12c2e7.png)
>
> !\[2\](https://user-images.githubusercontent.com/6459792/77183519-5c21a880-6ac6-11ea-99e1-d48fb2b77d1c.png)
>
> Even on watches that should now report OK report as failing... it's quite annoying.
>
> The only way I appear to fix is is by recreating the watch, am I doing something wrong here? The watcher config is as follows:
>
> \`\`\`
> "freshdesk\_alert" : {
> "webhook" : {
> "method" : "POST",
> "host" : "X.freshdesk.com",
> "path" : "/api/v2/tickets",
> "scheme" : "https",
> "port" : 443,
> "body" : {
> "inline": {
> "subject": "X",
> "description": "X",
> "email": "devops@X.com",
> "priority": 3,
> "status": 2,
> "group\_id" : 6000196835,
> "custom\_fields" : {
> "customer": "Actual Experience",
> "it\_or\_devops\_support\_required": "Product Fault/Bug",
> "end\_customer": "N/A",
> "cf\_internal\_logging\_codes\_1": "IT Incident",
> "cf\_internal\_logging\_codes\_2": "Network/Infrastructure",
> "cf\_internal\_logging\_codes\_3": "Event"
> }
> }
> },
> "auth" : {
> "basic" : {
> "username" : "{{PASSWORDADDEDBYCI}}",
> "password" : "X"
> }
> },
> "headers" : {
> "Content-Type" : "application/json"
> }
> }
> },
> \`\`\`
>
> Original Failure:
>
> https://pastebin.com/6zi9pkkQ 1
>
> Consequitve Watches Listed As Error:
>
> https://pastebin.com/KQ8hbtje 1
>
> This is just a visual problem as the action hasn't required to fire again, but it led me to believe that there was a problem with the watch.
>
> A retry mechanism would go a long way here also, unless this already exists?
---
### Author:  [@spinscale](https://discuss.elastic.co/u/spinscale)
#### Post date: [March 23, 2020, 10:37am UTC](https://discuss.elastic.co/t/when-watcher-http-action-fails-it-reports-it-fails-forever-without-ever-actually-retrying/224395/7 "2020-03-23T10:37:42Z")
Hey,
Thanks a bunch for the issue.
I think you may be wrong on the retrying part part here. Please check **all the consecutive** watcher history outputs if the condition is met at one point again, but the state does not get updated. I suppose this is not the case, but I would like to be sure. The reason why I ask for this is to be sure, that the execution is not disturbed by that and we're all on the same page regarding understanding.
--Alex
---
### Author:  [@runtman](https://discuss.elastic.co/u/runtman)
#### Post date: [March 23, 2020, 11:21am UTC](https://discuss.elastic.co/t/when-watcher-http-action-fails-it-reports-it-fails-forever-without-ever-actually-retrying/224395/8 "2020-03-23T11:21:58Z")
By retry I meant, it the watch alarms, and HTTP fails with 502, it would be cool to add retry3 for example, it will try HTTP again and then again before finally failing.
I don't currently have any watches in this failed state, so when I it happensagain, ill ensure to trigger another alert to see if it then triggers the HTTP action. Ok?
---
### Author:  [@spinscale](https://discuss.elastic.co/u/spinscale)
#### Post date: [March 23, 2020, 11:22am UTC](https://discuss.elastic.co/t/when-watcher-http-action-fails-it-reports-it-fails-forever-without-ever-actually-retrying/224395/9 "2020-03-23T11:22:56Z")
ah, I get it. Thx for the explanation! Indeed, currently there is only always a single request being sent within an action.
---
### Author:  [@runtman](https://discuss.elastic.co/u/runtman)
#### Post date: [March 24, 2020, 11:18am UTC](https://discuss.elastic.co/t/when-watcher-http-action-fails-it-reports-it-fails-forever-without-ever-actually-retrying/224395/10 "2020-03-24T11:18:34Z")
As requested, once it finally does handle that HTTP output again, it works and clears the "error" state.

---
### Author:  [@system](https://discuss.elastic.co/u/system)
#### Post date: [April 21, 2020, 11:18am UTC](https://discuss.elastic.co/t/when-watcher-http-action-fails-it-reports-it-fails-forever-without-ever-actually-retrying/224395/11 "2020-04-21T11:18:56Z")
This topic was automatically closed 28 days after the last reply. New replies are no longer allowed.