Hey guys, I found the root of our issue was actually on a misconfigured filter on the logstash end that was clogging the filter workers queue. I guess that manifested itself eventually in filebeats's logs.
Workarounds: older versions require you to increase congestion_threshold, newer versions require you to increase client_inactivity_timeout. In either case it's a good idea trying to figure out the reason for the slowdowns in LS, like some expensive filters.
Yeah mine was a case where we had a DNS filter with the wrongs dns ip's in it, so it was doomed to utter failure. However, in cases where honest throughput is just so heavy that it slows you these tools could still definitely help. Would increasing logstash worker number or increasing filebeat worker numbers be expected to help in a situation like that??
there are a number of options in filebeat to increase throughput (some at the cost of increased memory usage).
e.g. filebeat.publish_async and output.logstash.pipelined. Adding workers + enabling load balancing can increase throughput as well (depends on mix of workers, filebeat.spool_size and output.logstash.bulk_max_size).
Hi, sadly our test did not proceed well, none of the above workaround worked 100%, we were still getting that error.
As we had the opportunity, we moved to a larger cluster: 3 HUGE machines. We expected one of them to be able to take the whole load but we used 3 for test.
It happened again. EOF
Thus it could not be a problem of fully loaded machine so we moved to changing other parameters.
We found out that removing load_balance in filebeat solved the problem, or at least it seems to.
Again using only 1 single logstash output in filebeat works good (we split our source in 3 group and each group goes to one LS machine), now we have this configuration from 24h and it's working pretty well.
This is not a good solution for us, as we have a cluster of machines we wants it to be working efficiently and reliably.
Do you have any idea on why this is happening? how may we solve it?
now I have logstash with 24 workers 8GB of heap space, everything else is default as you suggested (better machines, no throughput problems!)
filebeat default batch size and time
they fail with the EOF error in filebeat and no log being collected form that machine.
now I have the same configuration, no load balancer, logger machines are divided in group and each group mapped one single LS node, and it is working
filter I use are just elapsed, grok and mutate as of now, i don't want to extend before I know it is working
can you share logs from logstash and filebeat + filebeat configuration + logstash beats input settings? EOF (end of file) is triggered by some remote closing the socket for whatever reason, it's not in the control of filebeat itself. I don't see how proper load-balancing in filebeat can trigger an EOF in filebeat, besides potential longer waiting times. Plus beats should reconnect upon EOF, that is, it's not really be critical.
after 2 days running, EOF came out also with the configuration without load_balance.
this is the stats from kibana -> I connected the filebeat log itself (it has been cut but the search is in kibana is "EOF")
it seems that they appear especially during night (off-load period)
We've done it about 3h ago: still 3 EOF messages in the last hour (as expected they arrive during lunch time when load is low, now it's increasing again. next will be this evening when load is decreasing)
Can you please share you beats input configuration in logstash + logs from logstash at times you discovered the timeouts?
As I said, EOF is not critical, as beats will reconnect. Logstash might still close connection if it finds connection to be "idle" (e.g. very very low sending rate). Which seems to be the case here. Once beats finds it has new events to send it will reconnect and send events. If load-balancing is used, these idle-phases will increase in duration, that's why connections being closed in case of load-balancing is more likely.
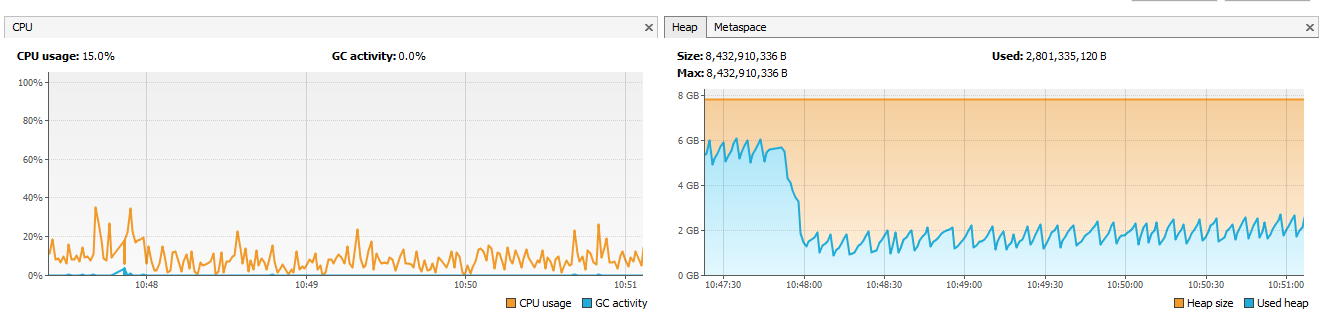
During night your idea might hold, but during lunch time we are not at absolute zero, today we received 3 EOF but logs arrived at an average rate of 30 of logs per second. below the trend on the machine, the EOF arrived at 13.55.50 after 2 minutes at 30 l/s
the connection EOF is logged as error, due to beats not being able to tell why connection has been closed by logstash or some device in between. If beats can reconnect, it's all ok. If beats can not reconnect for a long time this error should be taken more serious.
ok but my error stays there for 10 hours during night 3 or 4 times per minute: it's long enough, isn't it?
I don't get why this is intended to work in this way, I have enough capacity, the system is not loaded and it stops connection. It sounds strange to me: I expect it to collect data and ack them until it is ready to process.
Do you have an other solution to solve this in my case? It's strange nobody else found it.
Put a Redis in the middle may help? I do really need a solution to stop such errors.
3 to 4 times per minute is quite a lot. Your settings should be ok for 5 minutes. Any other device or firewall rules in between possibly closing connections? How long does it normally take for filebeat to reconnect?
Checking the code how the timer is setup it seems to use netty its IdleStateHandler. Setting client_inactivity_timeout to 0 should disable the idle connection closer in logstash.
I found the client timeout code here. Unfortunately the log message is on debug level. Maybe you can change the logging level and recompile.
Have you tried any other values for client_inactivity_timeout ?
Have you checked active connection on logstash host via netstat?
If filebeat still get's EOF even with client_inactivity_timeout 0 (disables read timer), it's not logstash closing the connection but some other networking unit.
I don't get why this is intended to work in this way, I have enough capacity, the system is not loaded and it stops connection
I guess Logstash tries to close inactive connections to protect itself from some kind of resource exhaustion regarding zombie-connections. TCP + network devices by nature is pretty fragile. Often times the connection might be dropped by some intermediary device or some service/device just crashing ending with some kind of Zombie-connection. This is due to TCP being stateful + requiring messages in order to synchronise state. Unfortunately sometimes these messages will not be send or received for different reasons ending with one end thinking the connection has been closed and the other end not being aware of any close events. Another property of TCP adding to this effect is, normally no messages are send if nothing needs to be send. That is, TCP implementations can not distinguish between connection loss and idle connection in this case. Your OS might time out idle connections after some amount of time as well (something like 2 hours). Long idle times on server + closes on client can result in hughe amount of zombie-connections taking resources on server. This kind of problem exists for any protocol using long-living TCP connections.
If disabling timer does not work for you, you can still give redis or kafka a try. When using redis be aware of resiliency options in redis, to not loose any logs if redis goes down for example.
we try a few parameter per day: now we put close_inactive_timeout = 0 and tomorrow we will see
It's difficult to say: we are working in a very large and complex network, we tried to check but we found nothing, any tcp socket we try to open between our machines is working fine, thus i suppose network is working. We just run a tcpdump on LS machine in a windows where 2 EOF happened. we found about 16 TCP RST from LS to FB
do you suggest any alternative method to test network?
In netstat I see established connection with all machine we are using
Apache, Apache Lucene, Apache Hadoop, Hadoop, HDFS and the yellow elephant
logo are trademarks of the
Apache Software Foundation
in the United States and/or other countries.