For some reason Logstash probably think it should be tailing the input file. Remove the sincedb file (see the file input docs for details) or set the file input's sincedb_path option to "/dev/null". If that doesn't help, simplify your configuration by replacing the elasticesearch output with a stdout { codec => rubydebug } output and comment out the multiline codec.
Hi Magnus, I've updated my file.cong ... these are the new changes:
Input Section:
id => "htmlLogs"
type => "log"
sincedb_path => "/dev/null"
Filter Section:
if [type] == "log"
grok {
id => "htmlLogs".....
Output Section:
if [type] == "log"
http {
id => "htmlLogs"....
And I removed
elasticsearch { }
So this is my current file.conf:
# THIS FILE HAS THE INPUT + FILTER AND OUTPUT OF HTML FILES (FOR THE BUGS)
# THIS IS THE INPUT CONFIGURATION
input {
  file {
    id => "htmlLogs"
    path => "/home/logs/create-dbaas-service/30742430.htm"
    type => "log"
    start_position => beginning
    sincedb_path => "/dev/null"
    ignore_older => 0
    codec => multiline {
      pattern => "Job"
      negate => true
      what => "next"
      auto_flush_interval => 5
    }
  }
}
# THIS IS THE FILTER CONFIGURATION
filter {
  if [type] == "log" {
    grok {
      id => "htmlLogs"
      match => { "message" => "<h1>%{DATA:Job_word}%{SPACE}%{NUMBER:job_id}</h1><table><tr><th>%{DATA:Domain_word}</th><td>%{DATA:Domain_id}</td></tr><tr><th>%{DATA:Service_word}</th><td>%{DATA:Service_id}</td></tr><tr><th>%{DATA:Namespace_word</th><td>%{DATA:Namespace_type}</td></tr><tr><th>%{DATA:ServiceType_word}</th><td>%{DATA:ServiceType_id}</td></tr><tr><th>%{DATA:ComputeSite_word}</th><td>%{DATA:ComputeSite_id}</td></tr><tr><th>>%{DATA:Username_word}</th><td>%{DATA:Username_value}</td></tr><tr><th>%{DATA:Operation_word}</th><td>%{DATA:Operation_value}</td></tr><tr><th>%{DATA:Status_word}</th><td>%{DATA:Status_value}</td></tr><tr><th>%{DATA:SubStatus_word}</th><td>%{DATA:SubStatus_value</td></tr><tr><th>%{DATA:CreateTime_word}</th><td>%{TIMESTAMP_ISO8601}</td></tr><tr><th>%{DATA:StartTime_word}</th><td>%{TIMESTAMP_ISO8601}</td></tr><tr><th>%{DATA:EndTime_word}</th><td>%{TIMESTAMP_ISO8601}</td></tr><tr><th>%{DATA:UpdateTime_word}</th><td>%{TIMESTAMP_ISO8601}</td></tr><tr><th>%{DATA:JobInfo_word}</th><td>%{DATA:JobInfo_text}</td></tr><tr><th>%{DATA:RequestParameters_word}</th><td>%{DATA:RequestParameters_log}</tr><tr><th>%{DATA:SupplementalLogs_word}</th><td>%{DATA:SupplementalLogs_value}</td></tr><tr><th>%{DATA:Summary_word}</th><td><pre>%{DATA:Summary_log}</pre></td></tr></table>" }
    }
  }
}
# THIS IS THE OUTPUT CONFIGURATION
output { stdout { codec => rubydebug }
  if [type] == "log" {
    http {
      id => "htmlLogs"
      http_method => "put"
      url => "http://localhost:9200"
      format => "message"
      message => '{
         "Domain_id": "%{Domain_id}",
         "Service_id": "%{Service_id}",
         "Namespace_type": "%{Namespace_type}",
         "ServiceType_id": "%{ServiceType_id}",
         "ComputeSite_id": "%{ComputeSite_id}",
         "Username_value": "%{Username_value}",
         "Operation_value": "%{Operation_value}",
         "Status_value": "%{Status_value}",
         "Summary_log": "%{Summary_log}", }'
    }
  }
}
and this is the log output (error) -PART1-:
[2018-08-31T19:24:06,026][INFO ][logstash.runner          ] Starting Logstash {"logstash.version"=>"6.4.0"}
[2018-08-31T19:24:08,894][ERROR][logstash.agent ] Failed to execute action {:action=>LogStash::PipelineAction::Create/pipeline_id:main, :exception=>"Java::OrgLogstashConfigIr::InvalidIRException", :message=>"Config has duplicate Ids: \nID: htmlLogs P[input-file{\"id\"=>\"htmlLogs\", \"path\"=>\"/home/logs/create-dbaas-service/30742430.htm\", \"type\"=>\"log\", \"start_position\"=>\"beginning\", \"sincedb_path\"=>\"/dev/null\", \"ignore_older\"=>0, \"codec\"=>#<Java::OrgLogstashConfigIrImperative::PluginStatement:0x396d88e3>}|[str]pipeline:18:3:```\nfile {\n id => \"htmlLogs\"\n path => \"/home/logs/create-dbaas-service/30742430.htm\"\n type => \"log\"\n start_position => beginning\n sincedb_path => \"/dev/null\"\n ignore_older => 0\n codec => multiline {\n pattern => \"Job\"\n negate => true\n what => \"next\"\n auto_flush_interval => 5\n }\n }\n```]\nP[filter-grok{\"id\"=>\"htmlLogs\", \"match\"=>{\"message\"=>\"<h1>%{DATA:Job_word}%{SPACE}%{NUMBER:job_id}</h1><table><tr><th>%{DATA:Domain_word}</th><td>%{DATA:Domain_id}</td></tr><tr><th>%{DATA:Service_word}</th><td>%{DATA:Service_id}</td></tr><tr><th>%{DATA:Namespace_word</th><td>%{DATA:Namespace_type}</td></tr><tr><th>%{DATA:ServiceType_word}</th><td>%{DATA:ServiceType_id}</td></tr><tr><th>%{DATA:ComputeSite_word}</th><td>%{DATA:ComputeSite_id}</td></tr><tr><th>>%{DATA:Username_word}</th><td>%{DATA:Username_value}</td></tr><tr><th>%{DATA:Operation_word}</th><td>%{DATA:Operation_value}</td></tr><tr><th>%{DATA:Status_word}</th><td>%{DATA:Status_value}</td></tr><tr><th>%{DATA:SubStatus_word}</th><td>%{DATA:SubStatus_value</td></tr><tr><th>%{DATA:CreateTime_word}</th><td>%{TIMESTAMP_ISO8601}</td></tr><tr><th>%{DATA:StartTime_word}</th><td>%{TIMESTAMP_ISO8601}</td></tr><tr><th>%{DATA:EndTime_word}</th><td>%{TIMESTAMP_ISO8601}</td></tr><tr><th>%{DATA:UpdateTime_word}</th><td>%{TIMESTAMP_ISO8601}</td></tr><tr><th>%{DATA:JobInfo_word}</th><td>%{DATA:JobInfo_text}</td></tr><tr><th>%{DATA:RequestParameters_word}</th><td>%{DATA:RequestParameters_log}</tr><tr><th>%{DATA:SupplementalLogs_word}</th><td>%{DATA:SupplementalLogs_value}</td></tr><tr><th>%{DATA:Summary_word}</th><td><pre>%{DATA:Summary_log}</pre></td></tr></table>\"}}|[str]pipeline:36:5:```\ngrok {\n id => \"htmlLogs\"\n match => { \"message\" => \"<h1>%{DATA:Job_word}%{SPACE}%{NUMBER:job_id}</h1><table><tr><th>%{DATA:Domain_word}</th><td>%{DATA:Domain_id}</td></tr><tr><th>%{DATA:Service_word}</th><td>%{DATA:Service_id}</td></tr><tr><th>%{DATA:Namespace_word</th><td>%{DATA:Namespace_type}</td></tr><tr><th>%{DATA:ServiceType_word}</th><td>%{DATA:ServiceType_id}</td></tr><tr><th>%{DATA:ComputeSite_word}</th><td>%{DATA:ComputeSite_id}</td></tr><tr><th>>%{DATA:Username_word}</th><td>%{DATA:Username_value}</td></tr><tr><th>%{DATA:Operation_word}</th><td>%{DATA:Operation_value}</td></tr><tr><th>%{DATA:Status_word}</th><td>%{DATA:Status_value}</td></tr><tr><th>%{DATA:SubStatus_word}</th><td>%{DATA:SubStatus_value</td></tr><tr><th>%{DATA:CreateTime_word}</th><td>%{TIMESTAMP_ISO8601}</td></tr><tr><th>%{DATA:StartTime_word}</th><td>%{TIMESTAMP_ISO8601}</td></tr><tr><th>%{DATA:EndTime_word}</th><td>%{TIMESTAMP_ISO8601}</td></tr><tr><th>%{DATA:UpdateTime_word}</th><td>%{TIMESTAMP_ISO8601}</td></tr><tr><th>%{DATA:JobInfo_word}</th><td>%{DATA:JobInfo_text}</td></tr><tr><th>%{DATA:RequestParameters_word}</th><td>%{DATA:RequestParameters_log}</tr><tr><th>%{DATA:SupplementalLogs_word}</th><td>%{DATA:SupplementalLogs_value}</td></tr><tr><th>%{DATA:Summary_word}</th><td><pre>%{DATA:Summary_log}</pre></td></tr></table>\" }\n }\n```]\nP[output-http{\"id\"=>\"htmlLogs\", \"http_method\"=>\"put\", \"url\"=>\"http://localhost:9200\", \"format\"=>\"message\", \"message\"=>\"{ \\n \\\"Domain_id\\\": \\\"%{Domain_id}\\\",\\n \\\"Service_id\\\": \\\"%{Service_id}\\\",\\n \\\"Namespace_type\\\": \\\"%{Namespace_type}\\\",\\n \\\"ServiceType_id\\\": \\\"%{ServiceType_id}\\\",\\n \\\"ComputeSite_id\\\": \\\"%{ComputeSite_id}\\\",\\n \\\"Username_value\\\": \\\"%{Username_value}\\\",\\n \\\"Operation_value\\\": \\\"%{Operation_value}\\\",\\n \\\"Status_value\\\": \\\"%{Status_value}\\\",\\n \\\"Summary_log\\\": \\\"%{Summary_log}\\\", }\"}|[str]pipeline:45:5:```\nhttp {\n id => \"htmlLogs\"\n http_method => \"put\"\n url => \"http://localhost:9200\"\n format => \"message\"\n message => '{ \n \"Domain_id\": \"%{Domain_id}\",\n \"Service_id\": \"%{Service_id}\",\n \"Namespace_type\": \"%{Namespace_type}\",\n \"ServiceType_id\": \"%{ServiceType_id}\",\n \"ComputeSite_id\": \"%{ComputeSite_id}\",\n \"Username_value\": \"%{Username_value}\",\n \"Operation_value\": \"%{Operation_value}\",\n \"Status_value\": \"%{Status_value}\",\n \"Summary_log\": \"%{Summary_log}\", }'\n }\n```]", :backtrace=>-PART2-:
["org.logstash.config.ir.graph.Graph.validate(org/logstash/config/ir/graph/Graph.java:294)", "org.logstash.config.ir.PipelineIR.<init>(org/logstash/config/ir/PipelineIR.java:52)", "java.lang.reflect.Constructor.newInstance(java/lang/reflect/Constructor.java:423)", "org.jruby.javasupport.JavaConstructor.newInstanceDirect(org/jruby/javasupport/JavaConstructor.java:246)", "org.jruby.RubyClass.newInstance(org/jruby/RubyClass.java:1022)", "org.jruby.RubyClass$INVOKER$i$newInstance.call(org/jruby/RubyClass$INVOKER$i$newInstance.gen)", "usr.share.logstash.logstash_minus_core.lib.logstash.compiler.compile_sources(/usr/share/logstash/logstash-core/lib/logstash/compiler.rb:29)", "usr.share.logstash.logstash_minus_core.lib.logstash.compiler.RUBY$method$compile_sources$0$__VARARGS__(usr/share/logstash/logstash_minus_core/lib/logstash//usr/share/logstash/logstash-core/lib/logstash/compiler.rb)", "org.jruby.RubyClass.finvoke(org/jruby/RubyClass.java:899)", "org.jruby.RubyBasicObject.callMethod(org/jruby/RubyBasicObject.java:372)", "org.logstash.config.ir.ConfigCompiler.configToPipelineIR(org/logstash/config/ir/ConfigCompiler.java:32)", "org.logstash.execution.AbstractPipelineExt.initialize(org/logstash/execution/AbstractPipelineExt.java:157)", "org.logstash.execution.AbstractPipelineExt$INVOKER$i$3$0$initialize.call(org/logstash/execution/AbstractPipelineExt$INVOKER$i$3$0$initialize.gen)", "usr.share.logstash.logstash_minus_core.lib.logstash.pipeline.initialize(/usr/share/logstash/logstash-core/lib/logstash/pipeline.rb:22)", "usr.share.logstash.logstash_minus_core.lib.logstash.pipeline.initialize(/usr/share/logstash/logstash-core/lib/logstash/pipeline.rb:90)", "org.jruby.RubyClass.newInstance(org/jruby/RubyClass.java:1022)", "org.jruby.RubyClass$INVOKER$i$newInstance.call(org/jruby/RubyClass$INVOKER$i$newInstance.gen)", "usr.share.logstash.logstash_minus_core.lib.logstash.pipeline_action.create.execute(/usr/share/logstash/logstash-core/lib/logstash/pipeline_action/create.rb:38)", "usr.share.logstash.logstash_minus_core.lib.logstash.pipeline_action.create.RUBY$method$execute$0$__VARARGS__(usr/share/logstash/logstash_minus_core/lib/logstash/pipeline_action//usr/share/logstash/logstash-core/lib/logstash/pipeline_action/create.rb)", "usr.share.logstash.logstash_minus_core.lib.logstash.agent.block in converge_state(/usr/share/logstash/logstash-core/lib/logstash/agent.rb:309)", "org.jruby.RubyProc.call(org/jruby/RubyProc.java:289)", "org.jruby.RubyProc.call(org/jruby/RubyProc.java:246)", "java.lang.Thread.run(java/lang/Thread.java:748)"]}
    [2018-08-31T19:24:09,013][FATAL][logstash.runner          ] An unexpected error occurred! {:error=>#<LogStash::Error: Don't know how to handle `Java::OrgLogstashConfigIr::InvalidIRException` for `PipelineAction::Create<main>`>, :backtrace=>["org/logstash/execution/ConvergeResultExt.java:103:in `create'", "org/logstash/execution/ConvergeResultExt.java:34:in `add'", "/usr/share/logstash/logstash-core/lib/logstash/agent.rb:321:in `block in converge_state'"]}
    [2018-08-31T19:24:09,267][ERROR][org.logstash.Logstash    ] java.lang.IllegalStateException: Logstash stopped processing because of an error: (SystemExit) exit
if you see the current problem seems that the GROK is not getting the correct values, maybe I should mutate the fields... but I am not sure... do you have some suggestion, regarding this new error?
Thanks!


As the error message indicates you can't have two plugins with the same id.
Thanks Magnus, the log is not showing errors, nevertheless I have not received any value (checking in kibana the monitoring section)...

And also in Discovery section when I select Logstash I am seeing that something is not defined correctly...
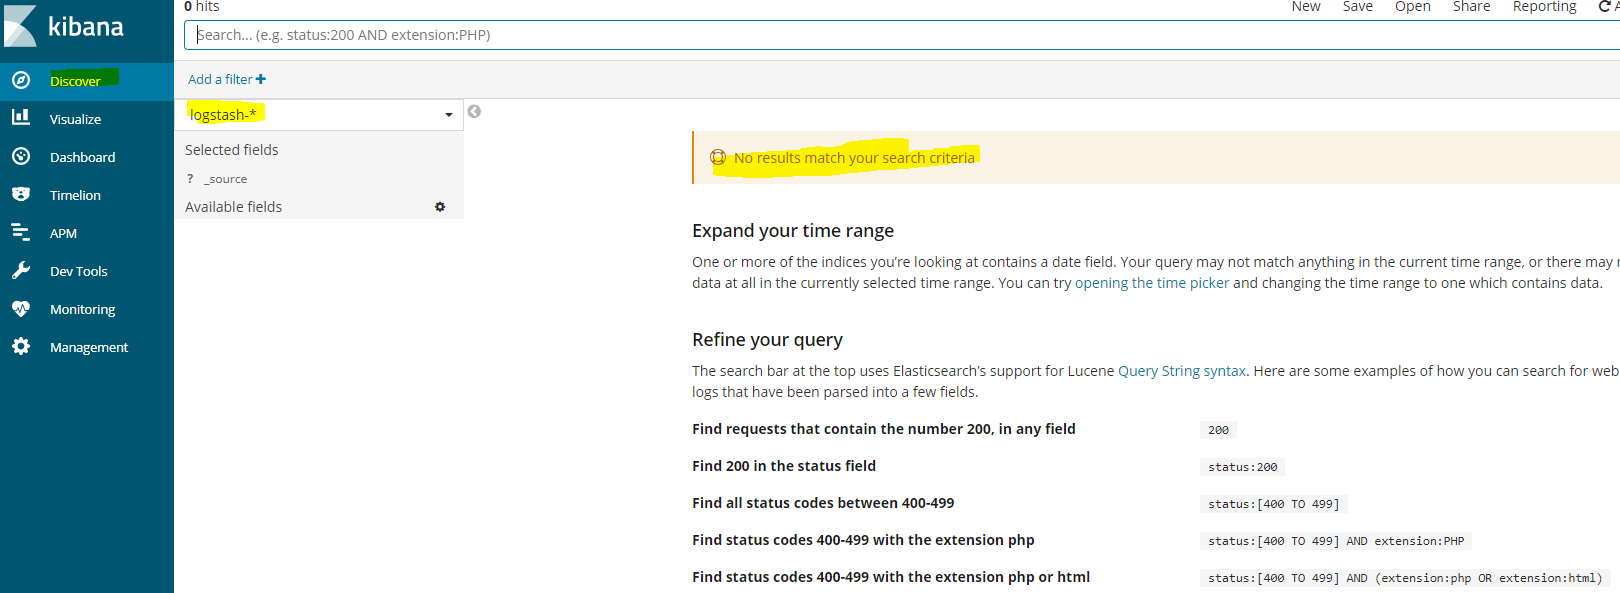
So, I assume that my parsing action is not defined correctly... here is my CONF file and well, I will check some threads to try to improve my parsing from HTML.
> # THIS FILE HAS THE INPUT + FILTER AND OUTPUT OF HTML FILES (FOR THE BUGS)
> # THIS IS THE INPUT CONFIGURATION
> input {
>   file {
>     id => "htmlLogs_input_file"
>     path => "/home/logs/create-dbaas-service/30742430.htm"
>     type => "log"
>     start_position => beginning
>     sincedb_path => "/dev/null"
>     ignore_older => 0
>     codec => multiline {
>       pattern => "Job"
>       negate => true
>       what => "next"
>       auto_flush_interval => 5
>     }
>   }
> }
> # THIS IS THE FILTER CONFIGURATION
> filter {
>   if [type] == "log" {
>     grok {
>       id => "htmlLogs_filter_grok"
>       match => { "message" => "<h1>%{DATA:Job_word}%{SPACE}%{NUMBER:job_id}</h1><table><tr><th>%{DATA:Domain_word}</th><td>%{DATA:Domain_id}</td></tr><tr><th>%{DATA:Service_word}</th><td>%{DATA:Service_id}</td></tr><tr><th>%{DATA:Namespace_word</th><td>%{DATA:Namespace_type}</td></tr><tr><th>%{DATA:ServiceType_word}</th><td>%{DATA:ServiceType_id}</td></tr><tr><th>%{DATA:ComputeSite_word}</th><td>%{DATA:ComputeSite_id}</td></tr><tr><th>>%{DATA:Username_word}</th><td>%{DATA:Username_value}</td></tr><tr><th>%{DATA:Operation_word}</th><td>%{DATA:Operation_value}</td></tr><tr><th>%{DATA:Status_word}</th><td>%{DATA:Status_value}</td></tr><tr><th>%{DATA:SubStatus_word}</th><td>%{DATA:SubStatus_value</td></tr><tr><th>%{DATA:CreateTime_word}</th><td>%{TIMESTAMP_ISO8601}</td></tr><tr><th>%{DATA:StartTime_word}</th><td>%{TIMESTAMP_ISO8601}</td></tr><tr><th>%{DATA:EndTime_word}</th><td>%{TIMESTAMP_ISO8601}</td></tr><tr><th>%{DATA:UpdateTime_word}</th><td>%{TIMESTAMP_ISO8601}</td></tr><tr><th>%{DATA:JobInfo_word}</th><td>%{DATA:JobInfo_text}</td></tr><tr><th>%{DATA:RequestParameters_word}</th><td>%{DATA:RequestParameters_log}</tr><tr><th>%{DATA:SupplementalLogs_word}</th><td>%{DATA:SupplementalLogs_value}</td></tr><tr><th>%{DATA:Summary_word}</th><td><pre>%{DATA:Summary_log}</pre></td></tr></table>" }
>     }
>   }
> }
> # THIS IS THE OUTPUT CONFIGURATION
> output { stdout { codec => rubydebug }
>   if [type] == "log" {
>     http {
>       id => "htmlLogs_output_http"
>       http_method => "put"
>       url => "http://localhost:9200"
>       format => "message"
>       message => '{
>          "Domain_id": "%{Domain_id}",
>          "Service_id": "%{Service_id}",
>          "Namespace_type": "%{Namespace_type}",
>          "ServiceType_id": "%{ServiceType_id}",
>          "ComputeSite_id": "%{ComputeSite_id}",
>          "Username_value": "%{Username_value}",
>          "Operation_value": "%{Operation_value}",
>          "Status_value": "%{Status_value}",
>          "Summary_log": "%{Summary_log}", }'
>     }
>   }
> }
It will be great If you have some idea or if you can advise me with some examples to get some data from a HTML file log.
THANKS again!
Why are you using an http output to talk to ES? Use an elasticsearch output.
The JSON string you're trying to post to ES is invalid, by the way (trailing space at the end).
Thanks to reply Magnus!
Regarding why I used JSON string, it was because I checked an example to parse HTML in Logstash and I tried to repeat the example (but well it doesn't work... this the example that I tried to use)...
Doing the action that you told me about to use ES in my output... this is the new file.conf :
# THIS FILE HAS THE INPUT + FILTER AND OUTPUT OF HTML FILES (FOR THE BUGS)
# THIS IS THE INPUT CONFIGURATION
input {
  file {
    id => "htmlLogs_input_file"
    path => "/home/logs/create-dbaas-service/30742430.htm"
    type => "htm"
    start_position => beginning
    sincedb_path => "/dev/null"
    ignore_older => 0
    codec => multiline {
      pattern => "Job"
      negate => true
      what => "next"
      auto_flush_interval => 5
    }
  }
}
# THIS IS THE FILTER CONFIGURATION
filter {
  if [type] == "htm" {
    grok {
      id => "htmlLogs_filter_grok"
      match => { "message" => "<h1>%{DATA:Job_word}%{SPACE}%{NUMBER:job_id}</h1><table><tr><th>%{DATA:Domain_word}</th><td>%{DATA:Domain_id}</td></tr><tr><th>%{DATA:Service_word}</th><td>%{DATA:Service_id}</td></tr><tr><th>%{DATA:Namespace_word</th><td>%{DATA:Namespace_type}</td></tr><tr><th>%{DATA:ServiceType_word}</th><td>%{DATA:ServiceType_id}</td></tr><tr><th>%{DATA:ComputeSite_word}</th><td>%{DATA:ComputeSite_id}</td></tr><tr><th>>%{DATA:Username_word}</th><td>%{DATA:Username_value}</td></tr><tr><th>%{DATA:Operation_word}</th><td>%{DATA:Operation_value}</td></tr><tr><th>%{DATA:Status_word}</th><td>%{DATA:Status_value}</td></tr><tr><th>%{DATA:SubStatus_word}</th><td>%{DATA:SubStatus_value</td></tr><tr><th>%{DATA:CreateTime_word}</th><td>%{TIMESTAMP_ISO8601}</td></tr><tr><th>%{DATA:StartTime_word}</th><td>%{TIMESTAMP_ISO8601}</td></tr><tr><th>%{DATA:EndTime_word}</th><td>%{TIMESTAMP_ISO8601}</td></tr><tr><th>%{DATA:UpdateTime_word}</th><td>%{TIMESTAMP_ISO8601}</td></tr><tr><th>%{DATA:JobInfo_word}</th><td>%{DATA:JobInfo_text}</td></tr><tr><th>%{DATA:RequestParameters_word}</th><td>%{DATA:RequestParameters_log}</tr><tr><th>%{DATA:SupplementalLogs_word}</th><td>%{DATA:SupplementalLogs_value}</td></tr><tr><th>%{DATA:Summary_word}</th><td><pre>%{DATA:Summary_log}</pre></td></tr></table>" }
    }
  }
}
# THIS IS THE OUTPUT CONFIGURATION
output {
  elasticsearch {
    hosts => ["localhost:9200"]
    id => "htmlLogs_output_ES" }
  stdout {
    codec => rubydebug }
... (unfortunately, I have the same behavior) I mean, I am not getting anything in Kibana:

I will change the html file (my log) to CSV file to try parsing a CSV file and check if this is easier to parse... or if you have some idea regarding how I could parse an HTML file.
Thanks!
if it useful... this is the logstash output (after make the new changes in file.conf) PART1:
[2018-09-04T14:59:05,997][INFO ][logstash.runner          ] Starting Logstash {"logstash.version"=>"6.4.0"}
[2018-09-04T14:59:10,469][WARN ][logstash.outputs.elasticsearch] You are using a deprecated config setting "document_type" set in elasticsearch. Deprecated settings will continue to work, but are scheduled for removal from logstash in the future. Document types are being deprecated in Elasticsearch 6.0, and removed entirely in 7.0. You should avoid this feature If you have any questions about this, please visit the #logstash channel on freenode irc. {:name=>"document_type", :plugin=><LogStash::Outputs::ElasticSearch bulk_path=>"/_xpack/monitoring/_bulk?system_id=logstash&system_api_version=2&interval=1s", hosts=>[http://localhost:9200], sniffing=>false, manage_template=>false, id=>"2196aa69258f6adaaf9506d8988cc76ab153e658434074dcf2e424e0aca0d381", document_type=>"%{[@metadata][document_type]}", enable_metric=>true, codec=><LogStash::Codecs::Plain id=>"plain_8dfa8acf-d4be-4601-bcc1-9ac653931af2", enable_metric=>true, charset=>"UTF-8">, workers=>1, template_name=>"logstash", template_overwrite=>false, doc_as_upsert=>false, script_type=>"inline", script_lang=>"painless", script_var_name=>"event", scripted_upsert=>false, retry_initial_interval=>2, retry_max_interval=>64, retry_on_conflict=>1, action=>"index", ssl_certificate_verification=>true, sniffing_delay=>5, timeout=>60, pool_max=>1000, pool_max_per_route=>100, resurrect_delay=>5, validate_after_inactivity=>10000, http_compression=>false>}
[2018-09-04T14:59:10,731][INFO ][logstash.pipeline        ] Starting pipeline {:pipeline_id=>".monitoring-logstash", "pipeline.workers"=>1, "pipeline.batch.size"=>2, "pipeline.batch.delay"=>50}
[2018-09-04T14:59:11,770][INFO ][logstash.outputs.elasticsearch] Elasticsearch pool URLs updated {:changes=>{:removed=>[], :added=>[http://localhost:9200/]}}
[2018-09-04T14:59:11,790][INFO ][logstash.outputs.elasticsearch] Running health check to see if an Elasticsearch connection is working {:healthcheck_url=>http://localhost:9200/, :path=>"/"}
[2018-09-04T14:59:12,059][WARN ][logstash.outputs.elasticsearch] Restored connection to ES instance {:url=>"http://localhost:9200/"}
[2018-09-04T14:59:12,131][INFO ][logstash.outputs.elasticsearch] ES Output version determined {:es_version=>6}
[2018-09-04T14:59:12,135][WARN ][logstash.outputs.elasticsearch] Detected a 6.x and above cluster: the `type` event field won't be used to determine the document _type {:es_version=>6}
[2018-09-04T14:59:12,171][INFO ][logstash.outputs.elasticsearch] New Elasticsearch output {:class=>"LogStash::Outputs::ElasticSearch", :hosts=>["http://localhost:9200"]}
[2018-09-04T14:59:12,555][INFO ][logstash.licensechecker.licensereader] Elasticsearch pool URLs updated {:changes=>{:removed=>[], :added=>[http://localhost:9200/]}}
[2018-09-04T14:59:12,557][INFO ][logstash.licensechecker.licensereader] Running health check to see if an Elasticsearch connection is working {:healthcheck_url=>http://localhost:9200/, :path=>"/"}
[2018-09-04T14:59:12,572][WARN ][logstash.licensechecker.licensereader] Restored connection to ES instance {:url=>"http://localhost:9200/"}
[2018-09-04T14:59:12,578][INFO ][logstash.licensechecker.licensereader] ES Output version determined {:es_version=>6}
[2018-09-04T14:59:12,579][WARN ][logstash.licensechecker.licensereader] Detected a 6.x and above cluster: the `type` event field won't be used to determine the document _type {:es_version=>6}
[2018-09-04T14:59:16,186][INFO ][logstash.pipeline        ] Pipeline started successfully {:pipeline_id=>".monitoring-logstash", :thread=>"#<Thread:0x3deb62a4 run>"}
[2018-09-04T14:59:16,663][WARN ][logstash.outputs.elasticsearch] You are using a deprecated config setting "document_type" set in elasticsearch. Deprecated settings will continue to work, but are scheduled for removal from logstash in the future. Document types are being deprecated in Elasticsearch 6.0, and removed entirely in 7.0. You should avoid this feature If you have any questions about this, please visit the #logstash channel on freenode irc. {:name=>"document_type", :plugin=><LogStash::Outputs::ElasticSearch index=>"%{[@metadata][beat]}-%{+YYYY.MM.dd}", sniffing=>true, manage_template=>false, id=>"27da80d3df062ced0a9e0fb3bcf5c5c8ebcae06aa73f997f9d1b3e8b8f0caeba", hosts=>[//localhost:9200], document_type=>"%{[@metadata][type]}", enable_metric=>true, codec=><LogStash::Codecs::Plain id=>"plain_85d3924a-ca1a-41e2-8957-455d0854e367", enable_metric=>true, charset=>"UTF-8">, workers=>1, template_name=>"logstash", template_overwrite=>false, doc_as_upsert=>false, script_type=>"inline", script_lang=>"painless", script_var_name=>"event", scripted_upsert=>false, retry_initial_interval=>2, retry_max_interval=>64, retry_on_conflict=>1, action=>"index", ssl_certificate_verification=>true, sniffing_delay=>5, timeout=>60, pool_max=>1000, pool_max_per_route=>100, resurrect_delay=>5, validate_after_inactivity=>10000, http_compression=>false>}PART2:
[2018-09-04T14:59:16,685][INFO ][logstash.pipeline        ] Starting pipeline {:pipeline_id=>"main", "pipeline.workers"=>2, "pipeline.batch.size"=>125, "pipeline.batch.delay"=>50}
[2018-09-04T14:59:16,740][INFO ][logstash.outputs.elasticsearch] Elasticsearch pool URLs updated {:changes=>{:removed=>[], :added=>[http://localhost:9200/]}}
[2018-09-04T14:59:16,748][INFO ][logstash.outputs.elasticsearch] Running health check to see if an Elasticsearch connection is working {:healthcheck_url=>http://localhost:9200/, :path=>"/"}
[2018-09-04T14:59:16,779][WARN ][logstash.outputs.elasticsearch] Restored connection to ES instance {:url=>"http://localhost:9200/"}
[2018-09-04T14:59:16,786][INFO ][logstash.outputs.elasticsearch] ES Output version determined {:es_version=>6}
[2018-09-04T14:59:16,786][WARN ][logstash.outputs.elasticsearch] Detected a 6.x and above cluster: the `type` event field won't be used to determine the document _type {:es_version=>6}
[2018-09-04T14:59:16,798][INFO ][logstash.outputs.elasticsearch] New Elasticsearch output {:class=>"LogStash::Outputs::ElasticSearch", :hosts=>["//localhost:9200"]}
[2018-09-04T14:59:16,803][INFO ][logstash.outputs.elasticsearch] Using mapping template from {:path=>nil}
[2018-09-04T14:59:16,813][INFO ][logstash.outputs.elasticsearch] Elasticsearch pool URLs updated {:changes=>{:removed=>[], :added=>[http://localhost:9200/]}}
[2018-09-04T14:59:16,814][INFO ][logstash.outputs.elasticsearch] Running health check to see if an Elasticsearch connection is working {:healthcheck_url=>http://localhost:9200/, :path=>"/"}
[2018-09-04T14:59:16,819][WARN ][logstash.outputs.elasticsearch] Restored connection to ES instance {:url=>"http://localhost:9200/"}
[2018-09-04T14:59:16,830][INFO ][logstash.outputs.elasticsearch] ES Output version determined {:es_version=>6}
[2018-09-04T14:59:16,831][WARN ][logstash.outputs.elasticsearch] Detected a 6.x and above cluster: the `type` event field won't be used to determine the document _type {:es_version=>6}
[2018-09-04T14:59:16,854][INFO ][logstash.outputs.elasticsearch] Attempting to install template {:manage_template=>{"template"=>"logstash-*", "version"=>60001, "settings"=>{"index.refresh_interval"=>"5s"}, "mappings"=>{"_default_"=>{"dynamic_templates"=>[{"message_field"=>{"path_match"=>"message", "match_mapping_type"=>"string", "mapping"=>{"type"=>"text", "norms"=>false}}}, {"string_fields"=>{"match"=>"*", "match_mapping_type"=>"string", "mapping"=>{"type"=>"text", "norms"=>false, "fields"=>{"keyword"=>{"type"=>"keyword", "ignore_above"=>256}}}}}], "properties"=>{"@timestamp"=>{"type"=>"date"}, "@version"=>{"type"=>"keyword"}, "geoip"=>{"dynamic"=>true, "properties"=>{"ip"=>{"type"=>"ip"}, "location"=>{"type"=>"geo_point"}, "latitude"=>{"type"=>"half_float"}, "longitude"=>{"type"=>"half_float"}}}}}}}}
[2018-09-04T14:59:16,873][INFO ][logstash.outputs.elasticsearch] New Elasticsearch output {:class=>"LogStash::Outputs::ElasticSearch", :hosts=>["//localhost:9200"]}
[2018-09-04T14:59:18,049][INFO ][logstash.inputs.beats    ] Beats inputs: Starting input listener {:address=>"0.0.0.0:5044"}
[2018-09-04T14:59:18,098][INFO ][logstash.pipeline        ] Pipeline started successfully {:pipeline_id=>"main", :thread=>"#<Thread:0x4a3ece66@/usr/share/logstash/logstash-core/lib/logstash/pipeline_action/create.rb:46 run>"}
[2018-09-04T14:59:18,220][INFO ][logstash.agent           ] Pipelines running {:count=>2, :running_pipelines=>[:main, :".monitoring-logstash"], :non_running_pipelines=>[]}
[2018-09-04T14:59:18,242][INFO ][org.logstash.beats.Server] Starting server on port: 5044
[2018-09-04T14:59:18,294][INFO ][filewatch.observingtail  ] START, creating Discoverer, Watch with file and sincedb collections
[2018-09-04T14:59:18,311][INFO ][logstash.inputs.metrics  ] Monitoring License OK
[2018-09-04T14:59:19,477][INFO ][logstash.agent           ] Successfully started Logstash API endpoint {:port=>9600}
[2018-09-04T14:59:22,030][INFO ][logstash.outputs.elasticsearch] Elasticsearch pool URLs updated {:changes=>{:removed=>[http://localhost:9200/], :added=>[http://127.0.0.1:9200/]}}
[2018-09-04T14:59:22,032][INFO ][logstash.outputs.elasticsearch] Running health check to see if an Elasticsearch connection is working {:healthcheck_url=>http://127.0.0.1:9200/, :path=>"/"}
[2018-09-04T14:59:22,060][WARN ][logstash.outputs.elasticsearch] Restored connection to ES instance {:url=>"http://127.0.0.1:9200/"}it seems that now is working... this is the new file.conf:
# THIS FILE HAS THE INPUT + FILTER AND OUTPUT OF HTML FILES (FOR THE BUGS)
# THIS IS THE INPUT CONFIGURATION
input {
  file {
    id => "htmlLogs_input_file"
    path => "/home/logs/create-dbaas-service/30742430.htm"
    type => "htm"
    start_position => beginning
    sincedb_path => "/dev/null"
  }
}
# THIS IS THE FILTER CONFIGURATION
filter {
  if [type] == "htm" {
    grok {
      id => "htmlLogs_filter_grok"
      match => { "message" => "<h1>%{DATA:Job_word}%{SPACE}%{NUMBER:job_id}</h1><table><tr><th>%{DATA:Domain_word}</th><td>%{DATA:Domain_id}</td></tr><tr><th>%{DATA:Service_word}</th><td>%{DATA:Service_id}</td></tr><tr><th>%{DATA:Namespace_word</th><td>%{DATA:Namespace_type}</td></tr><tr><th>%{DATA:ServiceType_word}</th><td>%{DATA:ServiceType_id}</td></tr><tr><th>%{DATA:ComputeSite_word}</th><td>%{DATA:ComputeSite_id}</td></tr><tr><th>>%{DATA:Username_word}</th><td>%{DATA:Username_value}</td></tr><tr><th>%{DATA:Operation_word}</th><td>%{DATA:Operation_value}</td></tr><tr><th>%{DATA:Status_word}</th><td>%{DATA:Status_value}</td></tr><tr><th>%{DATA:SubStatus_word}</th><td>%{DATA:SubStatus_value</td></tr><tr><th>%{DATA:CreateTime_word}</th><td>%{TIMESTAMP_ISO8601}</td></tr><tr><th>%{DATA:StartTime_word}</th><td>%{TIMESTAMP_ISO8601}</td></tr><tr><th>%{DATA:EndTime_word}</th><td>%{TIMESTAMP_ISO8601}</td></tr><tr><th>%{DATA:UpdateTime_word}</th><td>%{TIMESTAMP_ISO8601}</td></tr><tr><th>%{DATA:JobInfo_word}</th><td>%{DATA:JobInfo_text}</td></tr><tr><th>%{DATA:RequestParameters_word}</th><td>%{DATA:RequestParameters_log}</tr><tr><th>%{DATA:SupplementalLogs_word}</th><td>%{DATA:SupplementalLogs_value}</td></tr><tr><th>%{DATA:Summary_word}</th><td><pre>%{DATA:Summary_log}</pre></td></tr></table>" }
    }
  }
}
# THIS IS THE OUTPUT CONFIGURATION
output {
  elasticsearch {
    hosts => ["localhost:9200"]
    id => "htmlLogs_output_ES" }
  stdout {
    codec => rubydebug }
}
this is the discovery view in kibana...

and this is my monitoring view...
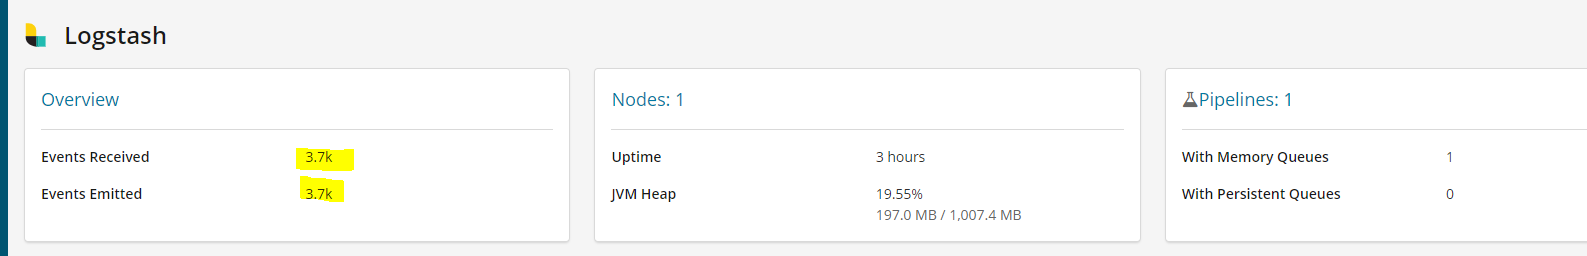
Now, I will try to upload more html logs... THANKS Magnus!!
PS. if I need something else, I will be creating a new thread!