Getting lots of watcher errors since upgrade to 6.3.1

Hi.
Since my upgrade from 6.3.0 to 6.3.1 I am seeing lots of these error messages in my elasticsearch system log file:

> [2018-07-08T11:24:21,265][WARN ][o.e.x.w.e.ExecutionService] [els04] failed to execute watch [V4mYkNZQQk60Vf8H3fnQmw_xpack_license_expiration]
> [2018-07-08T11:24:21,273][WARN ][o.e.x.w.e.ExecutionService] [els04] failed to execute watch [V4mYkNZQQk60Vf8H3fnQmw_kibana_version_mismatch]
> [2018-07-08T11:21:12,193][WARN ][o.e.x.w.e.ExecutionService] [els04] failed to execute watch [V4mYkNZQQk60Vf8H3fnQmw_logstash_version_mismatch]

Can I delete all my xpack watcher or somehow re-create them? All my Elasticsearch, Logstash and Kibana nodes are up to date to 6.3.1...

Thanks.

Hey,

can you share the following output

GET .watcher-history-*/_search
{
  "query": {
    "bool": {
      "filter": [
        {
          "term": {
            "watch_id": "V4mYkNZQQk60Vf8H3fnQmw_xpack_license_expiration"
          }
        }
      ]
    }
  },
  "sort": [
    {
      "trigger_event.triggered_time": {
        "order": "desc"
      }
    }
  ]
}

thanks!

You can also delete the watches and they should be recreated after a node restart (only tested this locally on a one node system however).

--Alex

Hi Alex. As requested:

root@els01:~# curl -u superuser -XGET localhost:9200/.watcher-history-*/_search?pretty
Enter host password for user 'superuser':
{
  "took" : 2525,
  "timed_out" : false,
  "_shards" : {
    "total" : 10,
    "successful" : 10,
    "skipped" : 0,
    "failed" : 0
  },
  "hits" : {
    "total" : 67944,
    "max_score" : 1.0,
    "hits" : [
      {
        "_index" : ".watcher-history-7-2018.06.21",
        "_type" : "doc",
        "_id" : "V4mYkNZQQk60Vf8H3fnQmw_xpack_license_expiration_309326f1-ab52-4c8d-85e3-a0769b577460-2018-07-08T10:54:23.529Z",
        "_score" : 1.0,
        "_source" : {
          "watch_id" : "V4mYkNZQQk60Vf8H3fnQmw_xpack_license_expiration",
          "node" : "TxWoHfJcTku0DA1uzm5KjQ",
          "state" : "not_executed_already_queued",
          "trigger_event" : {
            "type" : "schedule",
            "triggered_time" : "2018-06-21T07:54:10.238Z",
            "schedule" : {
              "scheduled_time" : "2018-06-21T07:54:10.050Z"
            }
          },
          "messages" : [
            "Watch is already queued in thread pool"
          ]
        }
      },
      {
        "_index" : ".watcher-history-7-2018.06.21",
        "_type" : "doc",
        "_id" : "V4mYkNZQQk60Vf8H3fnQmw_xpack_license_expiration_99f72a6f-3755-43e2-9e3c-8aa9d88c3da2-2018-07-08T10:54:23.530Z",
        "_score" : 1.0,
        "_source" : {
          "watch_id" : "V4mYkNZQQk60Vf8H3fnQmw_xpack_license_expiration",
          "node" : "TxWoHfJcTku0DA1uzm5KjQ",
          "state" : "not_executed_already_queued",
          "trigger_event" : {
            "type" : "schedule",
            "triggered_time" : "2018-06-21T08:02:39.057Z",
            "schedule" : {
              "scheduled_time" : "2018-06-21T08:02:38.736Z"
            }
          },
          "messages" : [
            "Watch is already queued in thread pool"
          ]
        }
      },
      {
        "_index" : ".watcher-history-7-2018.06.21",
        "_type" : "doc",
        "_id" : "V4mYkNZQQk60Vf8H3fnQmw_kibana_version_mismatch_45bdc9cb-8512-4059-ad8a-9e35e55aa783-2018-07-08T10:54:23.529Z",
        "_score" : 1.0,
        "_source" : {
          "watch_id" : "V4mYkNZQQk60Vf8H3fnQmw_kibana_version_mismatch",
          "node" : "TxWoHfJcTku0DA1uzm5KjQ",
          "state" : "not_executed_already_queued",
          "trigger_event" : {
            "type" : "schedule",
            "triggered_time" : "2018-06-21T08:01:53.269Z",
            "schedule" : {
              "scheduled_time" : "2018-06-21T08:01:52.615Z"
            }
          },
          "messages" : [
            "Watch is already queued in thread pool"
          ]
        }
      },
      {
        "_index" : ".watcher-history-7-2018.06.21",
        "_type" : "doc",
        "_id" : "V4mYkNZQQk60Vf8H3fnQmw_kibana_version_mismatch_9a8241f4-45f4-471e-8e33-6b03d02538a3-2018-07-08T10:54:23.530Z",
        "_score" : 1.0,
        "_source" : {
          "watch_id" : "V4mYkNZQQk60Vf8H3fnQmw_kibana_version_mismatch",
          "node" : "TxWoHfJcTku0DA1uzm5KjQ",
          "state" : "not_executed_already_queued",
          "trigger_event" : {
            "type" : "schedule",
            "triggered_time" : "2018-06-21T08:02:52.941Z",
            "schedule" : {
              "scheduled_time" : "2018-06-21T08:02:52.615Z"
            }
          },
          "messages" : [
            "Watch is already queued in thread pool"
          ]
        }
      },
      {
        "_index" : ".watcher-history-7-2018.06.21",
        "_type" : "doc",
        "_id" : "V4mYkNZQQk60Vf8H3fnQmw_logstash_version_mismatch_16c6c157-4db6-4abd-989b-4598a49b1034-2018-07-08T10:54:23.531Z",
        "_score" : 1.0,
        "_source" : {
          "watch_id" : "V4mYkNZQQk60Vf8H3fnQmw_logstash_version_mismatch",
          "node" : "TxWoHfJcTku0DA1uzm5KjQ",
          "state" : "not_executed_already_queued",
          "trigger_event" : {
            "type" : "schedule",
            "triggered_time" : "2018-06-21T08:03:04.041Z",
            "schedule" : {
              "scheduled_time" : "2018-06-21T08:03:03.688Z"
            }
          },
          "messages" : [
            "Watch is already queued in thread pool"
          ]
        }
      },
      {
        "_index" : ".watcher-history-7-2018.06.21",
        "_type" : "doc",
        "_id" : "V4mYkNZQQk60Vf8H3fnQmw_xpack_license_expiration_4b4226e3-cc50-4742-a9e7-0ef4a8c3a1fe-2018-07-08T10:54:23.532Z",
        "_score" : 1.0,
        "_source" : {
          "watch_id" : "V4mYkNZQQk60Vf8H3fnQmw_xpack_license_expiration",
          "node" : "TxWoHfJcTku0DA1uzm5KjQ",
          "state" : "not_executed_already_queued",
          "trigger_event" : {
            "type" : "schedule",
            "triggered_time" : "2018-06-21T08:03:38.960Z",
            "schedule" : {
              "scheduled_time" : "2018-06-21T08:03:38.736Z"
            }
          },
          "messages" : [
            "Watch is already queued in thread pool"
          ]
        }
      },
      {
        "_index" : ".watcher-history-7-2018.06.21",
        "_type" : "doc",
        "_id" : "V4mYkNZQQk60Vf8H3fnQmw_kibana_version_mismatch_bce7fbf2-0109-458e-a90f-095299cdf613-2018-07-08T10:54:23.532Z",
        "_score" : 1.0,
        "_source" : {
          "watch_id" : "V4mYkNZQQk60Vf8H3fnQmw_kibana_version_mismatch",
          "node" : "TxWoHfJcTku0DA1uzm5KjQ",
          "state" : "not_executed_already_queued",
          "trigger_event" : {
            "type" : "schedule",
            "triggered_time" : "2018-06-21T08:03:57.757Z",
            "schedule" : {
              "scheduled_time" : "2018-06-21T08:03:52.615Z"
            }
          },
          "messages" : [
            "Watch is already queued in thread pool"
          ]
        }
      },
      {
        "_index" : ".watcher-history-7-2018.06.21",
        "_type" : "doc",
        "_id" : "V4mYkNZQQk60Vf8H3fnQmw_xpack_license_expiration_d3a04ab6-6e56-4f5b-8acf-

I had to truncate the output as it was bigger than the maximum allowed text.....

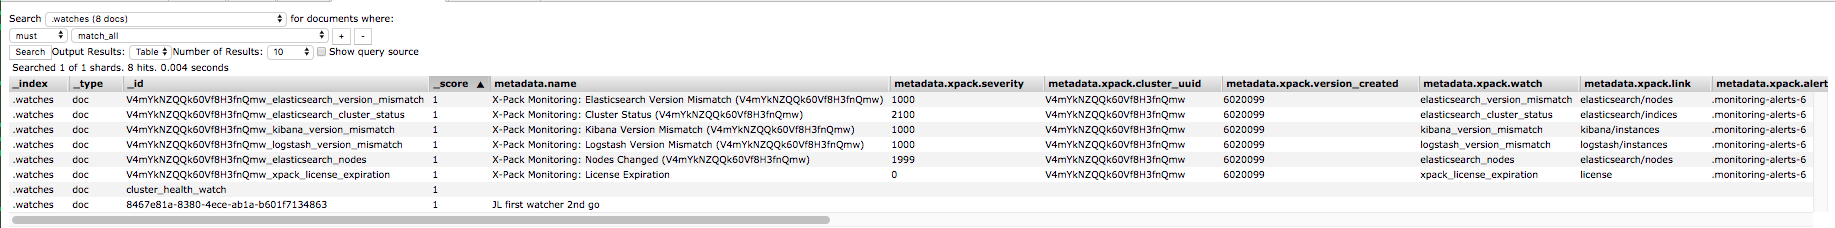
Just delete them all? I have nothing important there (yet) but will be doing some watchers soon...

Hey,

that is already enough. The watch seems to be stuck somehow, as it is already being executed.

Can you run and paste the result (or create a gist)

GET _xpack/watcher/stats?emit_stacktraces=true

Next you can try to stop and restart watcher

POST _xpack/watcher/_stop
# check if it is stopped here, if it is, restart
GET _xpack/watcher/stats
POST _xpack/watcher/_start

--Alex

Alex, as requested..

root@els01:~# curl -u superuser localhost:9200/_xpack/watcher/stats?emit_stacktraces=true?pretty
Enter host password for user 'superuser':
{"_nodes":{"total":6,"successful":6,"failed":0},"cluster_name":"cluster","manually_stopped":false,"stats":[{"node_id":"HNpW2xk5T4axf7SHgdJpFA","watcher_state":"started","watch_count":4,"execution_thread_pool":{"queue_size":0,"max_size":20}},{"node_id":"NBquctHQQNa-9_4jmJHIqA","watcher_state":"started","watch_count":0,"execution_thread_pool":{"queue_size":0,"max_size":1}},{"node_id":"KQv8B1MRQk28ZK7B_Zcx0g","watcher_state":"started","watch_count":0,"execution_thread_pool":{"queue_size":0,"max_size":0}},{"node_id":"Endbd0RfSGCl9IAVYGj3zw","watcher_state":"started","watch_count":0,"execution_thread_pool":{"queue_size":0,"max_size":0}},{"node_id":"JG3Brc2NRP6sKB_VluktKQ","watcher_state":"started","watch_count":0,"execution_thread_pool":{"queue_size":0,"max_size":0}},{"node_id":"TxWoHfJcTku0DA1uzm5KjQ","watcher_state":"started","watch_count":3,"execution_thread_pool":{"queue_size":0,"max_size":20}}]}root@els01:~# 
root@els01:~# 
root@els01:~# 

I have stopped and restarted and got a quick succession of the below messages on my data nodes

[2018-07-08T23:11:50,939][WARN ][o.e.x.w.e.ExecutionService] [els04] failed to execute watch [V4mYkNZQQk60Vf8H3fnQmw_kibana_version_mismatch]
[2018-07-08T23:11:52,406][WARN ][o.e.x.w.e.ExecutionService] [els04] failed to execute watch [V4mYkNZQQk60Vf8H3fnQmw_logstash_version_mismatch]
[2018-07-08T23:11:52,459][WARN ][o.e.x.w.e.ExecutionService] [els04] failed to execute watch [V4mYkNZQQk60Vf8H3fnQmw_xpack_license_expiration]
[2018-07-08T23:11:52,724][INFO ][o.e.m.j.JvmGcMonitorService] [els04] [gc][68078] overhead, spent [364ms] collecting in the last [1.1s]
[2018-07-08T23:11:53,178][WARN ][o.e.x.w.e.ExecutionService] [els04] failed to execute watch [V4mYkNZQQk60Vf8H3fnQmw_logstash_version_mismatch]
[2018-07-08T23:11:53,283][WARN ][o.e.x.w.e.ExecutionService] [els04] failed to execute watch [V4mYkNZQQk60Vf8H3fnQmw_xpack_license_expiration]
[2018-07-08T23:11:53,614][WARN ][o.e.x.w.e.ExecutionService] [els04] failed to execute watch [V4mYkNZQQk60Vf8H3fnQmw_logstash_version_mismatch]
[2018-07-08T23:11:53,615][WARN ][o.e.x.w.e.ExecutionService] [els04] failed to execute watch [V4mYkNZQQk60Vf8H3fnQmw_logstash_version_mismatch]

Hey,

so this is strange. Is three any watch history entry where the state is not "state" : "not_executed_already_queued"?

--Alex

HI. No they have all executed.
I also deleted all watchers with the API and then restarted all nodes. Watchers got re-created and again I'm getting the message in the log file.

Just checked my 4 ES nodes. It seems to be only 2 ES data nodes that is doing it..

Hey,

only the data nodes are supposed to execute watches, so this is normal.

The issue I am not yet understanding is the fact, that the watches are logged, as if the same watch is already running - however when using the emit_stacktraces=true parameter, you should see the stack trace of other watches being executed - as there is no stacktrace, there is no other watch being executed - which makes me confused where the error message in the watch history is coming from.

Did you configure anything special for watcher or monitoring?

Could you also test this with a fresh 6.3.2 installation? If I got you right, you upgraded from 6.3.1 before that. Did you do anything special during that upgrade?

I have a fresh output for your reference.

root@els01:~# curl -u superuser els01:9200/_xpack/watcher/stats?emit_stacktraces=true
Enter host password for user 'superuser':
{"_nodes":{"total":6,"successful":6,"failed":0},"cluster_name":"cluster","manually_stopped":false,"stats":[{"node_id":"Endbd0RfSGCl9IAVYGj3zw","watcher_state":"started","watch_count":0,"execution_thread_pool":{"queue_size":0,"max_size":0}},{"node_id":"NBquctHQQNa-9_4jmJHIqA","watcher_state":"started","watch_count":0,"execution_thread_pool":{"queue_size":0,"max_size":1}},{"node_id":"KQv8B1MRQk28ZK7B_Zcx0g","watcher_state":"started","watch_count":0,"execution_thread_pool":{"queue_size":0,"max_size":0}},{"node_id":"JG3Brc2NRP6sKB_VluktKQ","watcher_state":"started","watch_count":0,"execution_thread_pool":{"queue_size":0,"max_size":0}},{"node_id":"HNpW2xk5T4axf7SHgdJpFA","watcher_state":"started","watch_count":9,"execution_thread_pool":{"queue_size":0,"max_size":20}},{"node_id":"TxWoHfJcTku0DA1uzm5KjQ","watcher_state":"started","watch_count":4,"execution_thread_pool":{"queue_size":0,"max_size":20}}]}root@els01:~# curl -u superuser els01:9200/_xpack/watcher/stats?pretty
Enter host password for user 'superuser':
{
"_nodes" : {
"total" : 6,
"successful" : 6,
"failed" : 0
},
"cluster_name" : "cluster",
"manually_stopped" : false,
"stats" : [
{
"node_id" : "Endbd0RfSGCl9IAVYGj3zw",
"watcher_state" : "started",
"watch_count" : 0,
"execution_thread_pool" : {
"queue_size" : 0,
"max_size" : 0
}
},
{
"node_id" : "NBquctHQQNa-9_4jmJHIqA",
"watcher_state" : "started",
"watch_count" : 0,
"execution_thread_pool" : {
"queue_size" : 0,
"max_size" : 1
}
},
{
"node_id" : "KQv8B1MRQk28ZK7B_Zcx0g",
"watcher_state" : "started",
"watch_count" : 0,
"execution_thread_pool" : {
"queue_size" : 0,
"max_size" : 0
}
},
{
"node_id" : "JG3Brc2NRP6sKB_VluktKQ",
"watcher_state" : "started",
"watch_count" : 0,
"execution_thread_pool" : {
"queue_size" : 0,
"max_size" : 0
}
},
{
"node_id" : "HNpW2xk5T4axf7SHgdJpFA",
"watcher_state" : "started",
"watch_count" : 9,
"execution_thread_pool" : {
"queue_size" : 0,
"max_size" : 20
}
},
{
"node_id" : "TxWoHfJcTku0DA1uzm5KjQ",
"watcher_state" : "started",
"watch_count" : 4,
"execution_thread_pool" : {
"queue_size" : 0,
"max_size" : 20
}
}
]
}
root@els01:~#

Rebuilding the node will be a mean feat.. bit of work required.
Could the probem be cosmetic? My newly created watcher is working (jl first watcher 2nd go) as it's logging to the elastic log + emailing me...

Yes I went from 6.3.0 to 6.3.1 a couple of days ago.

can you share your watcher/monitoring configuration (cleaned up so no passwords are leaked)?

Yes, what would be the best command to run to get that info?

getting the nodes stats, nodes infos, and cluster settings

GET _nodes
GET _nodes/_stats
GET _cluster/settings

note, this spills out a lot more things... make sure that's ok by giving it a second look!

Hi, too much text to paste into here so I put it into pastebin.

https://pastebin.com/ryKGBH3A

Hey,

nothing sticks out here and I was unable to reproduce in local tests so far. May I ask you to run the execute watch API for one of those watches against each of those data nodes holding a watcher shard and also show the latest watch history again?

Thanks for sticking with me! Much appreciated!

--Alex

Just rang it against both my ES nodes that have a watcher shard (els03/els04).

refer https://pastebin.com/eibKpDxr

....

I did a quick scroll and system thinks I have Kibana 6.3.0 and 6.3.1?

extract:

"update_timestamp" : "2018-07-07T10:15:10.177Z",
                "prefix" : "This cluster is running with multiple versions of Kibana.",
                "message" : "Versions: [6.3.0, 6.3.1].",
                "resolved_timestamp" : "2018-07-07T10:15:10.177Z",
                "timestamp" : "2018-07-07T10:11:33.592Z"

just ran for logstash .. same

   "hits" : {
                "hits" : [
                  {
                    "_index" : ".monitoring-alerts-6",
                    "_type" : "doc",
                    "_source" : {
                      "metadata" : {
                        "severity" : 1000,
                        "cluster_uuid" : "V4mYkNZQQk60Vf8H3fnQmw",
                        "version_created" : 6020099,
                        "watch" : "logstash_version_mismatch",
                        "link" : "logstash/instances",
                        "alert_index" : ".monitoring-alerts-6",
                        "type" : "monitoring"
                      },
                      "update_timestamp" : "2018-07-07T10:15:10.177Z",
                      "prefix" : "This cluster is running with multiple versions of Logstash.",
                      "message" : "Versions: [6.3.0, 6.3.1].",
                      "resolved_timestamp" : "2018-07-07T10:15:10.177Z",
                      "timestamp" : "2018-07-07T10:10:32.870Z"
                    },

Hi, any idea where the watcher is collecting the version of logstash/kibana/elasticsearch

 "message" : "Versions: [6.3.0, 6.3.1].",

that message above is from a run from the 7th, where as your watch execution was three days later and did not trigger such an alert.

This looks ok to me from a high level view.

Have your watches executed in the meantime?

Did you check the elasticsearch ndoe logs of those nodes, which should execute those watches, was there anything out of the ordinary? Like issues creating operating system threads (I am wildly guessing).

This topic was automatically closed 28 days after the last reply. New replies are no longer allowed.