[again] Endpoint security immediately degraded

Hello. I know this has been asked a million times here, but i've tried everything i know and i still can't get it to work.

I have an Agent Policies with Network Packet Capture, Elastic Defend, and System integrations.
When I add an agent to that Agent Policies, it’s healthy for 30 seconds and immediately goes Unhealthy.

System spesification

OS: Ubuntu 20.04 using VPS
Kernel version: 5.4.0 (more details on Output of /proc/version attached below)
Elasticsearch, kibana, elastic-agent version: 8.5.0
Elastic Defend integration version: 8.5.0
Network Packet Capture integration version: 1.7.0
System integration: 1.20.4

Command used to enroll agent:

./elastic-agent install --url=https://xxx.xxx.xxx.xxx:8220 --enrollment-token=[the-token] --insecure

Output of /proc/version

# cat /proc/version

Linux version 5.4.0 (mockbuild@builder9.eng.sw.ru) (gcc version 4.8.5 20150623 (Red Hat 4.8.5-44) (GCC) ) #1 SMP Tue Jan 25 12:49:12 MSK 2022

Output of elastic-agent status:

# elastic-agent status

Status: DEGRADED
Message: app endpoint-security--8.5.0-9d736430: Protecting with policy {5df063a9-fe73-400e-b276-4bca25262c8a}
Applications:
  * endpoint-security    (DEGRADED)
                         Protecting with policy {5df063a9-fe73-400e-b276-4bca25262c8a}
  * filebeat             (HEALTHY)
                         Running
  * filebeat_monitoring  (HEALTHY)
                         Running
  * metricbeat           (HEALTHY)
                         Running
  * packetbeat           (HEALTHY)
                         Running

Output of elastic-agent diagnostics:

# elastic-agent diagnostics

elastic-agent  id: 0a63ea03-43db-49cd-b0e7-5b93a1f981aa                version: 8.5.0
               build_commit: 9da6ba5fce5d6b4d2c473c1f5ff6056794e9a644  build_time: 2022-10-24 20:21:40 +0000 UTC  snapshot_build: false
Applications:
  *  name: endpoint-security                                      route_key: default
     error: Get "http://unix/": dial unix /opt/Elastic/Agent/data/tmp/default/endpoint-security/endpoint-security.sock: connect: no such file or directory

Output of /opt/Elastic/Endpoint/state/log

# cat endpoint-000000.log | grep error

{"@timestamp":"2022-11-12T02:00:40.639363586Z","agent":{"id":"","type":"endpoint"},"ecs":{"version":"1.11.0"},"log":{"level":"error","origin":{"file":{"line":2876,"name":"Artifacts.cpp"}}},"message":"Artifacts.cpp:2876 Failed to download artifact diagnostic-configuration-v1 - Invalid url","process":{"pid":15896,"thread":{"id":15896}}}
{"@timestamp":"2022-11-12T02:00:40.639405139Z","agent":{"id":"","type":"endpoint"},"ecs":{"version":"1.11.0"},"log":{"level":"error","origin":{"file":{"line":647,"name":"Artifacts.cpp"}}},"message":"Artifacts.cpp:647 Artifact diagnostic-configuration-v1 download or verification failed","process":{"pid":15896,"thread":{"id":15896}}}
{"@timestamp":"2022-11-12T02:00:40.667775596Z","agent":{"id":"","type":"endpoint"},"ecs":{"version":"1.11.0"},"log":{"level":"info","origin":{"file":{"line":106,"name":"Internal.cpp"}}},"message":"Internal.cpp:106 sqlite3_prepare_v2 failed: rc=1, msg=SQL logic error","process":{"pid":15896,"thread":{"id":15896}}}
{"@timestamp":"2022-11-12T02:00:40.668425509Z","agent":{"id":"","type":"endpoint"},"ecs":{"version":"1.11.0"},"log":{"level":"error","origin":{"file":{"line":240,"name":"Tux_HostIsolation.cpp"}}},"message":"Tux_HostIsolation.cpp:240 Failed to mount bpf fs at /sys/fs/bpf: error 2","process":{"pid":15896,"thread":{"id":15908}}}
{"@timestamp":"2022-11-12T02:00:40.709841862Z","agent":{"id":"00000000-0000-0000-0000-000000000000","type":"endpoint"},"ecs":{"version":"1.11.0"},"log":{"level":"error","origin":{"file":{"line":534,"name":"Comms.cpp"}}},"message":"Comms.cpp:534 No valid comms client configured","process":{"pid":15896,"thread":{"id":15896}}}
{"@timestamp":"2022-11-12T02:01:05.493419385Z","agent":{"id":"0a63ea03-43db-49cd-b0e7-5b93a1f981aa","type":"endpoint"},"ecs":{"version":"1.11.0"},"log":{"level":"error","origin":{"file":{"line":2137,"name":"Config.cpp"}}},"message":"Config.cpp:2137 Initial configuration application failed","process":{"pid":15896,"thread":{"id":15944}}}
{"@timestamp":"2022-11-12T02:01:05.494140122Z","agent":{"id":"0a63ea03-43db-49cd-b0e7-5b93a1f981aa","type":"endpoint"},"ecs":{"version":"1.11.0"},"log":{"level":"error","origin":{"file":{"line":288,"name":"AgentContext.cpp"}}},"message":"AgentContext.cpp:288 Failed to apply new policy from Agent.","process":{"pid":15896,"thread":{"id":15944}}}
{"@timestamp":"2022-11-12T02:01:05.688412681Z","agent":{"id":"0a63ea03-43db-49cd-b0e7-5b93a1f981aa","type":"endpoint"},"ecs":{"version":"1.11.0"},"log":{"level":"error","origin":{"file":{"line":327,"name":"Http.cpp"}}},"message":"Http.cpp:327 CURL error 60: SSL peer certificate or SSH remote key was not OK [SSL certificate problem: self signed certificate in certificate chain]","process":{"pid":15896,"thread":{"id":15902}}}
{"@timestamp":"2022-11-12T02:05:47.523862196Z","agent":{"id":"0a63ea03-43db-49cd-b0e7-5b93a1f981aa","type":"endpoint"},"ecs":{"version":"1.11.0"},"log":{"level":"error","origin":{"file":{"line":2144,"name":"Config.cpp"}}},"message":"Config.cpp:2144 Policy failed to apply and rollback is disabled","process":{"pid":15896,"thread":{"id":15905}}}
{"@timestamp":"2022-11-12T02:05:48.568076681Z","agent":{"id":"0a63ea03-43db-49cd-b0e7-5b93a1f981aa","type":"endpoint"},"ecs":{"version":"1.11.0"},"log":{"level":"error","origin":{"file":{"line":327,"name":"Http.cpp"}}},"message":"Http.cpp:327 CURL error 60: SSL peer certificate or SSH remote key was not OK [SSL certificate problem: self signed certificate in certificate chain]","process":{"pid":15896,"thread":{"id":15902}}}

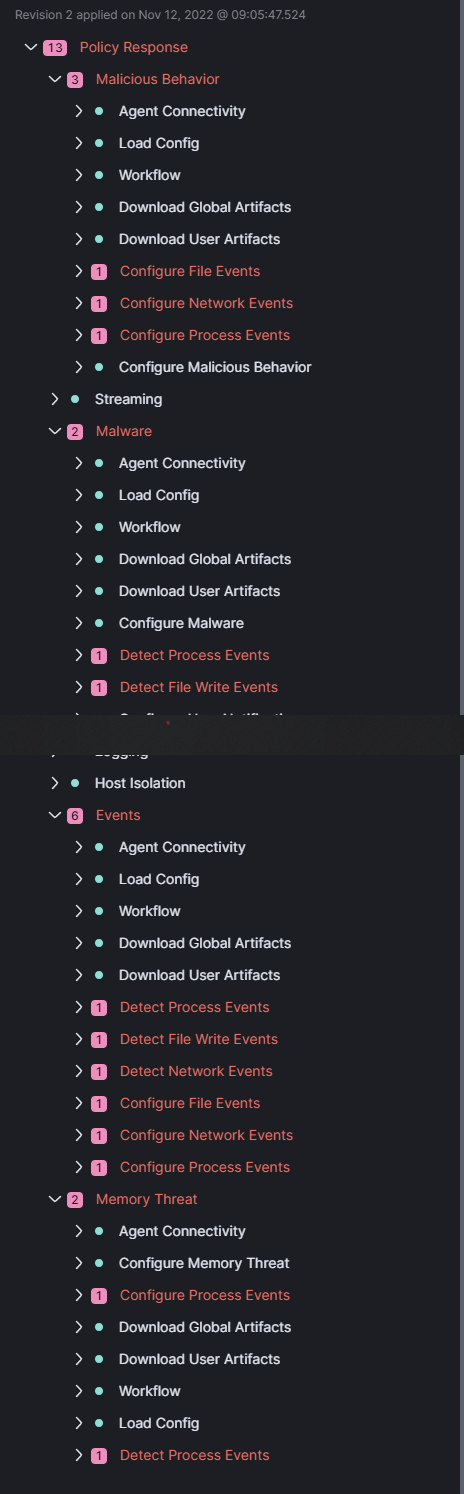
Security -> Endpoint page:
image

More detail:

What I have tried:

  1. restarting and reinstalling elastic-agent

  2. kernel security lockdown
    I got the same error message as the post above "Failed to mount bpf fs at /sys".

The post above tells me to look into /sys/kernel/security/lockdown but, probably because i'm using VPS, I don't have that file. I tried making one and it doesn't let me even though i'm root.

# cat /sys/kernel/security/lockdown
cat: /sys/kernel/security/lockdown: No such file or directory

# vim lockdown

"lockdown" E212: Can't open file for writing

# nano lockdown

[ Error writing lockdown: Permission denied ]

I'm basically scratching my head at this point. Any help would be appreciated!!

Did you try to verify that there is no restriction in the output rules of the edge firewall or of the machine itself such as UFW? I was having some problems like this, on Windows, in System integration, I disabled some features like loadcpu. Try to assess whether it is necessary to collect everything that comes in the integration. This can be confirmed at this link Monitor Elastic Agents | Fleet and Elastic Agent Guide [master] | Elastic

Here you can find some more tips:

Are you able to access /sys/kernel/debug/tracing/kprobe_events ?

Still no luck

# cd /sys/kernel/debug
-bash: cd: /sys/kernel/debug: No such file or directory

First, nice work with the detailed descriptions and screen captures. Very helpful. Should've mentioned it earlier.

TL;DR - It's unclear to me if the system in question is a VM or a container. Elastic Endpoint requires tracefs (or debugfs) to be mounted in order to enable event sources. Since containers share a single kernel space and tracefs is a kernel component, installing Elastic Endpoint in a container is unsupported. Installing Elastic Endpoint on a VM is supported, however.


Based on the included policy results, Elastic Endpoint is failing to apply policy because it cannot enable the event data sources.

For this kernel, Elastic Endpoint uses read-only kprobes installed using the tracefs (formerly debugfs) filesystem as event data sources. Here's a Linux kernel documentation link for the curious.

In older kernels, 4.0 and older, tracing was provided by debugfs. Since then, tracing has been moved out into a separate file system, tracefs, for security reasons. Here's StackOverflow link about it.

The path I asked you to check, /sys/kernel/debug/tracing/kprobe_events, exists for backwards compatibility reasons. For this kernel, the path /sys/kernel/debug would be mounted as debugfs, and the subdirectory, /sys/kernel/debug/tracing would be mounted as tracefs. I wonder if this system has tracefs mounted elsewhere. Running the following would rule that out:

$ mount | grep tracefs

Finally, if it's not already mounted, I wonder if tracefs could be mounted.

$ mkdir /tmp/tracing
$ mount -t tracefs none /tmp/tracing

My gut says that both of those will yield disappointing results. But, in the off chance tracefs can be mounted, create the directory /sys/kernel/debug/tracing and mount it there, and see how things go with Endpoint.

Otherwise, it seems Endpoint is just not supported on this particular configuration.

I wonder whether the system is a container or a VM. If it's a container, the only option is to install Endpoint in the container host. If it's a VM, understanding how to enable tracefs would be the path forward.

1 Like

First, thank you for responding and the clear explanation, makes me feel less bad for not figuring this thing out. Should've mentioned it earlier. and sorry for the late reply.

I ask the VPS provider and indeed it's using container.
The command mount | grep tracefs doesn't output anything. Which means (based on your explaination) I don't have tracefs anywhere on the system.
And as you expect, I can't mount tracefs manually

# mkdir /tmp/tracing
# mount -t tracefs none /tmp/tracing
mount: /tmp/tracing: unknown filesystem type 'tracefs'.

BUT! , interestingly (weirdly) enough, I installed elasticsearch, kibana, and elastic-agent version 7.17 with network packet capture v1.4.1 endpoint security v.1.3.0 and system integration v.1.11.0 on the same VPS provider and it works fine!

# cat /proc/version 
Linux version 5.4.0 (mockbuild@builder9.eng.sw.ru) (gcc version 4.8.5 20150623 (Red Hat 4.8.5-44) (GCC) ) #1 SMP Tue Jan 25 12:49:12 MSK 2022

# elastic-agent version
Binary: 7.17.7 (build: 2b200bdbf5d85553b8f02c8709142b01dfd1082d at 2022-10-17 19:26:46 +0000 UTC)
Daemon: 7.17.7 (build: 2b200bdbf5d85553b8f02c8709142b01dfd1082d at 2022-10-17 19:26:46 +0000 UTC)

# elastic-agent status
Status: HEALTHY
Message: (no message)
Applications:
  * metricbeat             (HEALTHY)
                           Running
  * packetbeat             (HEALTHY)
                           Running
  * endpoint-security      (HEALTHY)
                           Protecting with policy {18e8865c-0943-40ce-84a9-17428fe112b0}
  * filebeat               (HEALTHY)
                           Running
  * filebeat_monitoring    (HEALTHY)
                           Running
  * metricbeat_monitoring  (HEALTHY)
                           Running

When I check for tracefs and debugfs, it yields same result (doesn't exist)

# cd /sys/kernel/debug
-bash: cd: /sys/kernel/debug: No such file or directory

# mount | grep tracefs  # doesn't output anything

# cd /sys/kernel/security
-bash: cd: /sys/kernel/security: No such file or directory

Then I look the error message for elastic-agent version 7, and it also has the Failed to mount bpf fs at /sys/fs/bpf

# cat endpoint-000000.log | grep "error"

{"@timestamp":"2022-10-25T09:24:35.225467059Z","agent":{"id":"","type":"endpoint"},"ecs":{"version":"1.11.0"},"log":{"level":"error","origin":{"file":{"line":2830,"name":"Artifacts.cpp"}}},"message":"Artifacts.cpp:2830 Failed to download artifact diagnostic-configuration-v1 - Invalid url","process":{"pid":503249,"thread":{"id":503249}}}
{"@timestamp":"2022-10-25T09:24:35.225539868Z","agent":{"id":"","type":"endpoint"},"ecs":{"version":"1.11.0"},"log":{"level":"error","origin":{"file":{"line":636,"name":"Artifacts.cpp"}}},"message":"Artifacts.cpp:636 Artifact diagnostic-configuration-v1 download or verification failed","process":{"pid":503249,"thread":{"id":503249}}}
{"@timestamp":"2022-10-25T09:24:35.251777249Z","agent":{"id":"","type":"endpoint"},"ecs":{"version":"1.11.0"},"log":{"level":"error","origin":{"file":{"line":241,"name":"Tux_HostIsolation.cpp"}}},"message":"Tux_HostIsolation.cpp:241 Failed to mount bpf fs at /sys/fs/bpf: error 2","process":{"pid":503249,"thread":{"id":503262}}}
{"@timestamp":"2022-10-25T09:24:35.254171018Z","agent":{"id":"","type":"endpoint"},"ecs":{"version":"1.11.0"},"log":{"level":"info","origin":{"file":{"line":106,"name":"Internal.cpp"}}},"message":"Internal.cpp:106 sqlite3_prepare_v2 failed: rc=1, msg=SQL logic error","process":{"pid":503249,"thread":{"id":503249}}}
{"@timestamp":"2022-10-25T09:25:10.630389157Z","agent":{"id":"a0acbc3e-e37c-46aa-82d8-84087561f566","type":"endpoint"},"ecs":{"version":"1.11.0"},"log":{"level":"error","origin":{"file":{"line":2031,"name":"Config.cpp"}}},"message":"Config.cpp:2031 Initial configuration application failed","process":{"pid":503249,"thread":{"id":503381}}}
{"@timestamp":"2022-10-25T09:25:10.631499234Z","agent":{"id":"a0acbc3e-e37c-46aa-82d8-84087561f566","type":"endpoint"},"ecs":{"version":"1.11.0"},"log":{"level":"error","origin":{"file":{"line":430,"name":"AgentComms.cpp"}}},"message":"AgentComms.cpp:430 Failed to apply new policy from Agent.","process":{"pid":503249,"thread":{"id":503381}}}
{"@timestamp":"2022-10-25T09:34:05.567491706Z","agent":{"id":"a0acbc3e-e37c-46aa-82d8-84087561f566","type":"endpoint"},"ecs":{"version":"1.11.0"},"log":{"level":"error","origin":{"file":{"line":516,"name":"ProcFile.cpp"}}},"message":"ProcFile.cpp:516 Failed to parse proc maps line [55e3b5db0000-55e3b5dbb000 r--p 00000000 b6:acab1 11404411                /usr/sbin/sshd]","process":{"pid":503249,"thread":{"id":503275}}}
{"@timestamp":"2022-10-25T09:34:05.576960583Z","agent":{"id":"a0acbc3e-e37c-46aa-82d8-84087561f566","type":"endpoint"},"ecs":{"version":"1.11.0"},"log":{"level":"error","origin":{"file":{"line":516,"name":"ProcFile.cpp"}}},"message":"ProcFile.cpp:516 Failed to parse proc maps line [555c500c7000-555c500f4000 r--p 00000000 b6:acab1 11407418                /usr/bin/bash]","process":{"pid":503249,"thread":{"id":503275}}}

It then repeats the error message "Failed to parse proc maps line" many times.
But version 7.17 works for some reason.

I guess I'm just gonna use version 7.17 then. If you know what's going on with elastic-agent version 7.17 that makes it works, I'd be glad to know why! If you're equally clueless that's cool too as I finally able to make it work.

Thanks Nick!

Hello, thanks for your reply!

I forget to mention this in the original post but I've tried disabling some system and network packet capture function that aren't needed and it's still unhealthy

So, do I understand that right, that you can't install elastic defend on any container that is not docker (so in my case LXC container on Proxmox)?
Because I have the same problem that the agent immediately degrades and stops working.

Is there an alternative if I am just interested in getting the process and networking logs to the SIEM (and then correlated to the rules) without the actual endpoint protection? I remember that when I startet using ELK, I could add Filbeat and Packetbeat, etc. and that would be enough to have SIEM monitoring, but I guess this approach isn't possible like that anymore...

So, do I understand that right, that you can't install elastic defend on any container that is not docker (so in my case LXC container on Proxmox)?

Whether they be eBPF programs or tracefs kprobes, Elastic Defend's event sources reside in kernel. So, all activity on a host will be captured. If that host is running containers, all of the activity in each container will likewise be captured.

Elastic's recommendation is to install Elastic Defend in the container host, not in a container. Which unfortunately, especially when interacting with a host provider, can be difficult/impossible.

However, installing within a virtual machine is very much supported, as a VM is a different kernel.

How @CrazyDumpling was able to install 7.17 within a container is a mystery. Perhaps, event capture and malware is disabled?

Is there an alternative if I am just interested in getting the process and networking logs to the SIEM (and then correlated to the rules) without the actual endpoint protection? I remember that when I startet using ELK, I could add Filbeat and Packetbeat, etc. and that would be enough to have SIEM monitoring, but I guess this approach isn't possible like that anymore...

I'm not certain, but if Filebeat and Packetbeat worked within a container previously, it should be possible to set them up with Elastic Agent. I found this documentation. Perhaps not including the Elastic Defend integration, but selecting others will get you most of the way there.

Hope this blurb helps and answers your questions.

This topic was automatically closed 28 days after the last reply. New replies are no longer allowed.