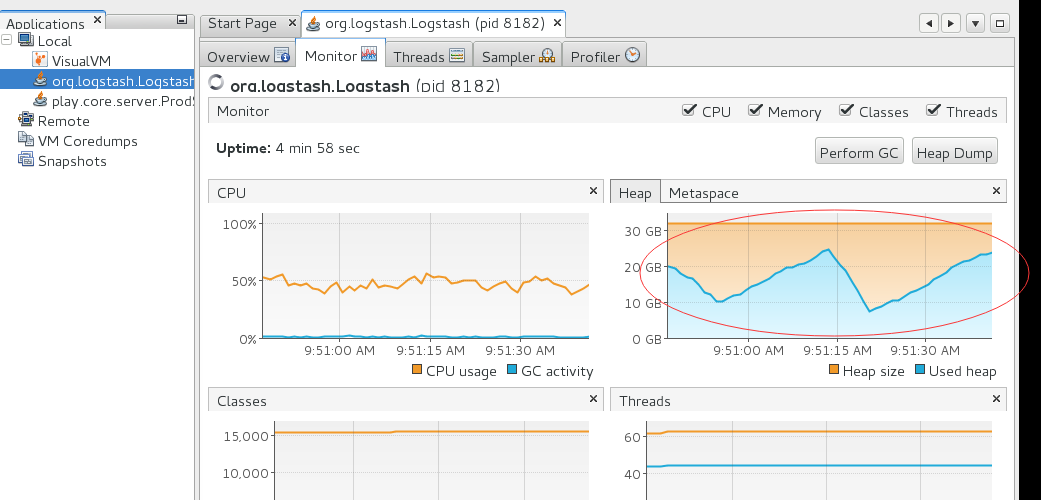
That looks like completely normal heap usage to me. When objects are allocated they are added to the heap. When heap utilization reaches 75% (CMSInitiatingOccupancyFraction) a CMS cycle will be kicked off which will garbage collect all the dead objects, thus reducing the heap utilization. Rinse and repeat.
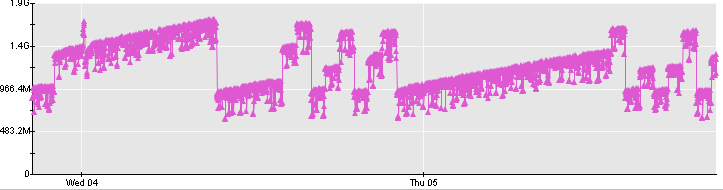
The heap usage in a JVM with a generational collector (either ParNew+CMS in HotSpot, or gencon in J9) has three sawtooth patterns at different frequencies. I do not have a chart that shows the middle frequency one, but this shows the low frequency (tenured) and high frequency (eden) patterns.
However, if we reduce the resolution (equivalent to zooming out) the high frequency pattern disappears. This is what we see in your image.
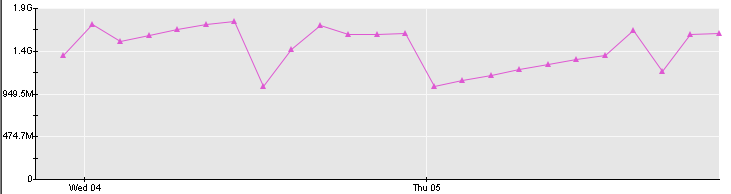
And if we further reduce the resolution the low frequency pattern also disappears and we are left with random noise, which is what we have in the document you linked to.
Apache, Apache Lucene, Apache Hadoop, Hadoop, HDFS and the yellow elephant
logo are trademarks of the
Apache Software Foundation
in the United States and/or other countries.