Kibana version:
Elasticsearch version:
APM Server version:
APM Agent language and version: 1.19.0 - dotnet
Browser version: 108.0.5359.125 - chrome
Original install method (e.g. download page, yum, deb, from source, etc.) and version: nuget
Fresh install or upgraded from other version? fresh
Is there anything special in your setup? no
Description of the problem including expected versus actual behavior. Please include screenshots (if relevant):
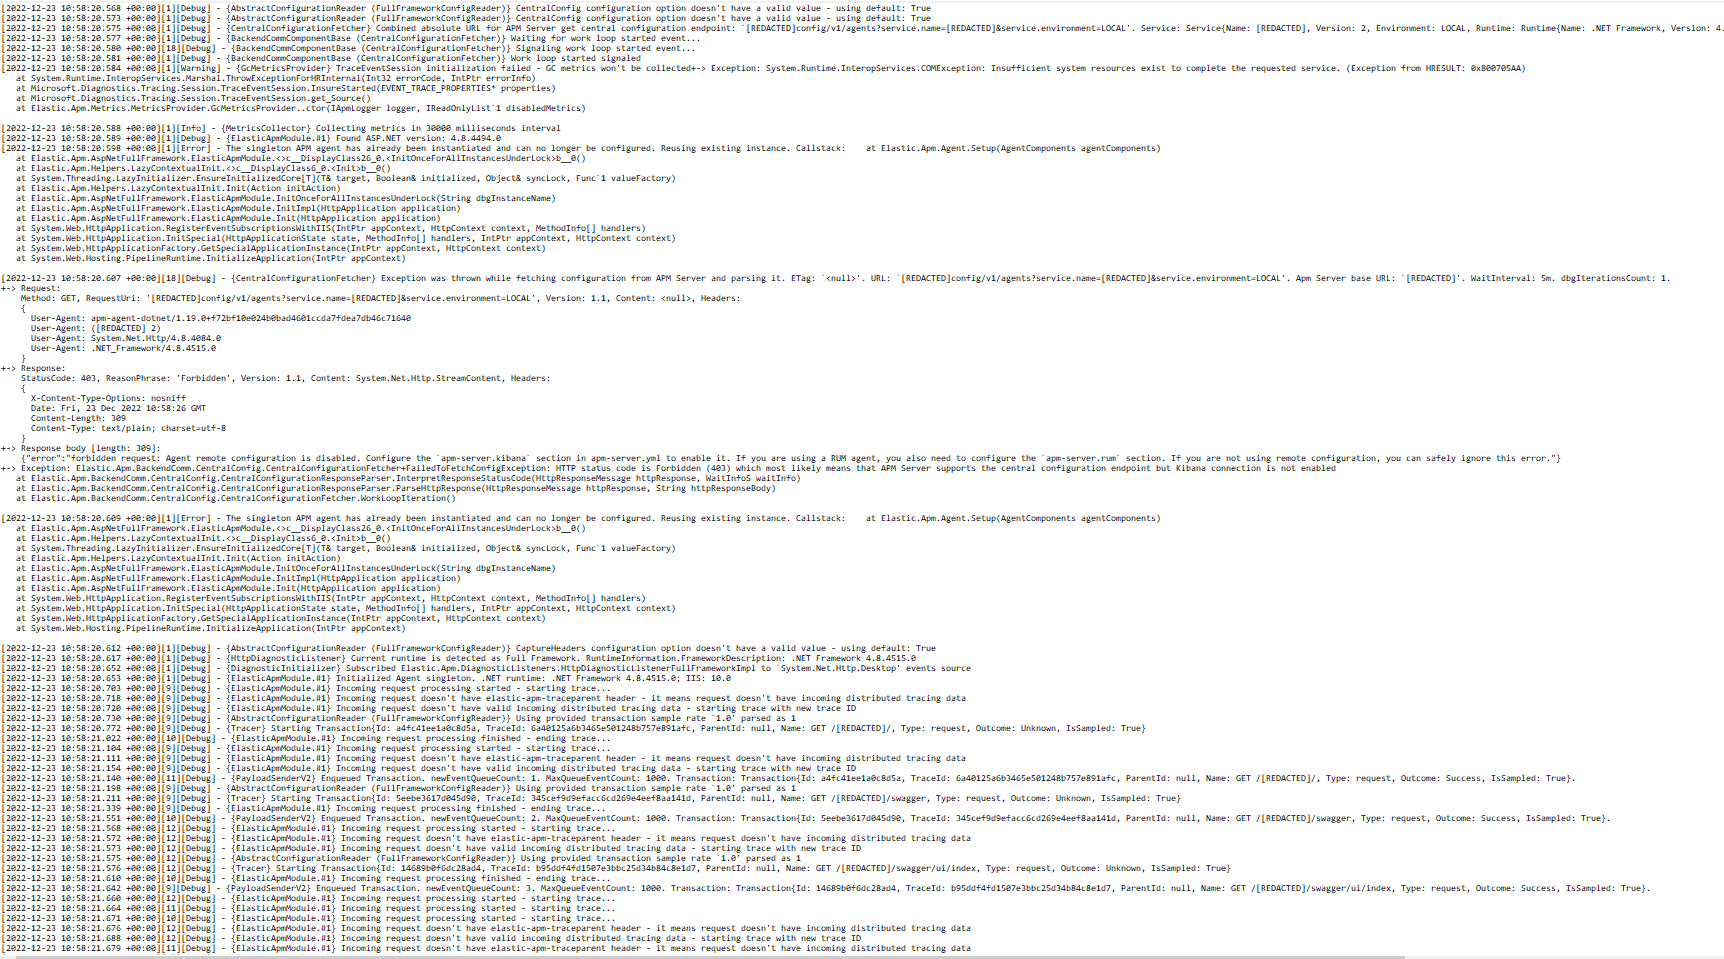
Working in .net core locally I had an issue stated in #1724, the application would hang because of the CPU metrics not being captured. After some search on the forums and on github I found that I could add the PerfomanceCounter key and some CPU values and the service would work fine. After the v.1.16.0 update I stopped needing to add this values on the configuration at all. Now I'm working on .net framework 4.6.2 service and the problem appeared again. If I add the new DisableMetrics setting to disable the cpu metrics the service stops hanging. Was this not added to .Net framework?
Provide logs and/or server output (if relevant): where are apm logs being saved?