APM Server upgradation to 7.17.6 is consuming more resources

Hi Elastic Fans...
I am in the process of upgrading ElasticAPMServer from 7.14.2 to 7.17.6
Things were working as expected in 7.14.2. To avoid vulnerability checks, we upgraded to 7.16.6
APMServer is managed by operator. Earlier three pods were sufficient for my sandbox/development cluster, now for the similar load HPA kicks in ... and I need to go till 10 pods with a reduction in throughput.

ask: are we making any mistakes? btw, grouping is done by 'kubernetes.pod.name' in below visualisations

Followed documentation w.r.t. breaking changes if any.. from here..

As far as my understanding goes w.r.t. breaking changes technically I had to just comment ilm /warm and change the version number in my manifest for apm-server.

Question:
Are there any hints that you can provide (we did not change any queue size and other sensitive parameters).
We made sure that support matrix for the elastic stack of products are followed.

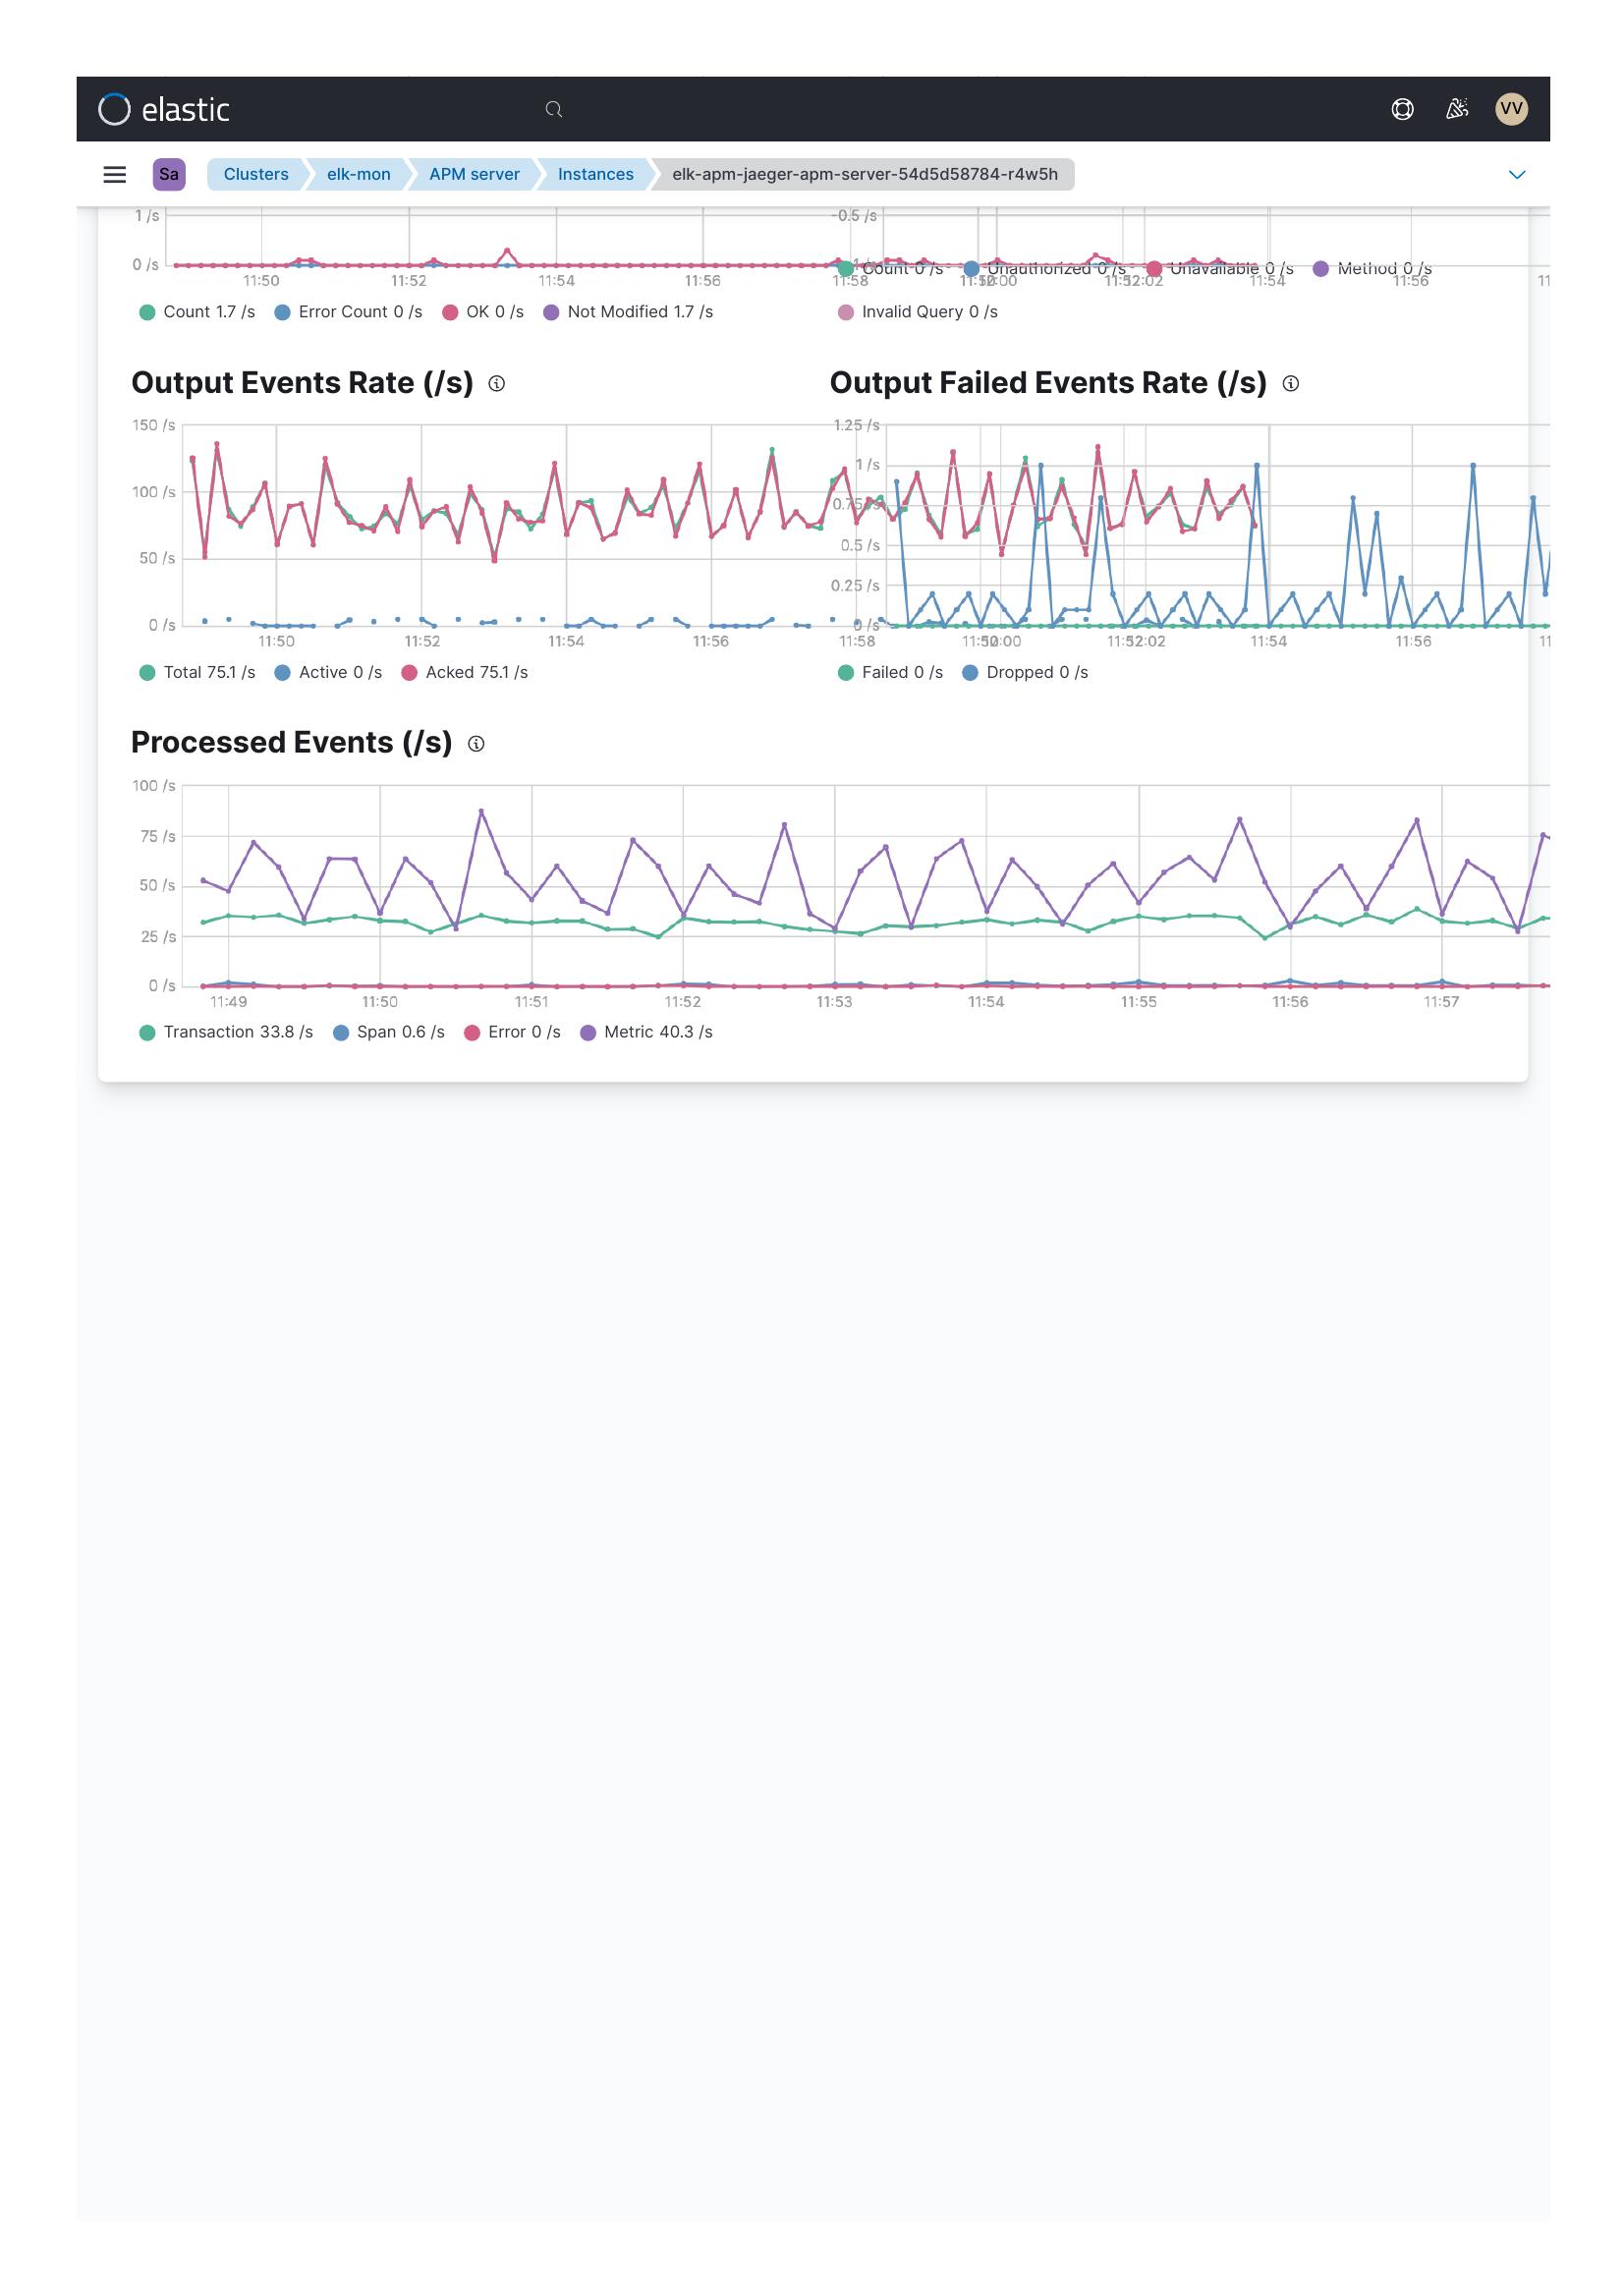
Unfortunately, we did not have internal monitoring nor xpack based metricbeat monitoring enabled for APMServer... So we do not have comparison data (before and after upgrade). But to be frank existing custom created dashboard/visualization is enough to indicate that there is an issue.

Hello!...
any clues?

Hello ....

am I in the wrong discussion forum?.. I am not getting replies? Or do I need to give some more information?

Sorry for the late reply, we didn't get notified of this because of missing APM & Server tags.

I'm not aware of any performance regressions between 7.14.2 and 7.17.6 -- it's not something we have come across so far.

ask: are we making any mistakes? btw, grouping is done by 'kubernetes.pod.name' in below visualisations

I can't say with certainty from the above information, but it doesn't sound like it.

Can you please share your apm-server config? Maybe that will help us narrow down. If you're able to bisect the version of APM Server which causes the performance change, that may also help.

@axw
Let me initiate procedural clearance about 'sharing' the config file in this forum. I need to abide certain rules. Is there any way, I can send it to only you? I know it defies the very concept of community learning. But there is nothing wrong in asking. eh!.

Coming back to my visualisations that I pasted, and you tried conveying me they convey nothing of significance.

How did I try to interpret?
They are coming from metric beat data. As you can see just before upgrade time, the cumulative CPU and memory usage was quite minimal w.r.t. post upgrade.
Now... if you say the memory usage and cpu usage (how did I create visualisation) is not part of criterion, then it is a different story.
For my eyes more important is... before and after upgrade, the input traffic was/is similar barring a spike. But output traffic is less indicating yeah.. there is some slowness (in addition to appx 10 pods).

Please correct me if my such level 0 interpretation is wrong. This will help me to wear my hat appropriately. The above upgradation data is from development cluster.

After much 'deliberation', I upgraded my 'staging' cluster, I am able to see similar impact. Details of which I will put here soon.

-Vinod

Hi @axw

I attached my yaml and internal monitoring output (legacy)..
To get rid of HPA kicking in repeatedly I increased my limits from 1unit to 2 (details below). Earlier cpu resource cpu limits was 1500m and 1000m. After increasing to 2500/ 2000m, HPA was calm and the total pods got reduced to 3(minimum defined in HPA).

Now: if you look at the internal monitoring output, after the upgrade, for merely processing < 7 requests per second, I see that CPU usage is high.

In my eyes, something is awry. The attached thing is for my 'sandbox' env. The similar thing is being observed for my staging as well as pre-prod.

I am attaching my yaml and internal monitoring output

          resources:
            limits:
              cpu: 2500m # changed from 1500
              memory: 1.5G
            requests:
              cpu: 2000m # changed from 1000
              memory: 800Mi

Entire yaml is here

apiVersion: v1
kind: Service
metadata:
  name: elk-apm-jaeger
  namespace: elastic-apm
spec:
  ports:
    - name: http
      protocol: TCP
      port: 14268
      targetPort: 14268
    - name: grpc
      protocol: TCP
      port: 14250
      targetPort: 14250
  selector:
    apm.k8s.elastic.co/name: elk-apm-jaeger
---
apiVersion: apm.k8s.elastic.co/v1
kind: ApmServer
metadata:
  name: elk-apm-jaeger
  namespace: elastic-apm
  annotations:
    eck.k8s.elastic.co/managed: "false"
spec:
  config:
    apm-server:
      ilm:
        enabled: auto
        setup:
          enabled: true
          mapping:
            - event_type: error
              index_suffix: development
              policy_name: apm-error-span-policy
            - event_type: span
              index_suffix: development
              policy_name: apm-error-span-policy
            - event_type: transaction
              index_suffix: development
              policy_name: apm-transaction-metric-policy
            - event_type: metric
              index_suffix: development
              policy_name: apm-transaction-metric-policy
          policies:
            - name: apm-error-span-policy
              policy:
                phases:
                  cold:
                    actions:
                      freeze: {}
                      set_priority:
                        priority: 0
                    min_age: 30d
                  delete:
                    actions:
                      delete: {}
                    min_age: 60d
                  hot:
                    actions:
                      rollover:
                        max_age: 30d
                        max_size: 30gb
                      set_priority:
                        priority: 100
                  #warm:
                  #  actions:
                  #    readonly: {}
                  #    set_priority:
                  #      priority: 50
                  #  min_age: 10d
            - name: apm-transaction-metric-policy
              policy:
                phases:
                  cold:
                    actions:
                      freeze: {}
                      set_priority:
                        priority: 0
                    min_age: 300d
                  delete:
                    actions:
                      delete: {}
                    min_age: 301d
                  hot:
                    actions:
                      rollover:
                        max_age: 30d
                        max_size: 30gb
                      set_priority:
                        priority: 100
                  #warm:
                  #  actions:
                  #    readonly: {}
                  #    set_priority:
                  #      priority: 50
                  #  min_age: 100d
      instrumentation:
        enabled: true
        environment: Dev
        hosts:
          - 'https://elk-apm-jaeger-apm-http.elastic-apm:8200'
        profiling.cpu.enable: true
        profiling.heap.enable: true
        secret_token: '${apm.token}'
      jaeger:
        grpc.enabled: true
        grpc.host: ':14250'
        http.enabled: true
        http.host: ':14268'
      kibana:
        enabled: true
        host: '${KIBANA_HOST}:${KIBANA_PORT}'
        password: '${ELASTICSEARCH_PASSWORD}'
        protocol: https
        ssl.enabled: true
        ssl.verification_mode: none
        username: '${ELASTICSEARCH_USERNAME}'
      secret_token: '${apm.token}'
      ssl.certificate: /etc/apm-cert/tls.crt
      ssl.enabled: true
      ssl.key: /etc/apm-cert/tls.key
      ssl.key_passphrase: '${apm.key_passphrase}'
    apm-server.rum.allow_headers:
      - header1
      - header2
    apm-server.rum.allow_origins:
      - '*'
    apm-server.rum.enabled: true
    apm-server.rum.event_rate.limit: 300
    apm-server.rum.event_rate.lru_size: 1000
    apm-server.rum.exclude_from_grouping: ^/webpack
    apm-server.rum.library_pattern: node_modules|bower_components|~
    apm-server.rum.source_mapping.cache.expiration: 5m
    apm-server.rum.source_mapping.enabled: true
    apm-server.rum.source_mapping.index_pattern: apm-*-sourcemap*
    logging.level: error
    logging.to_stderr: true
    monitoring:
      cluster_uuid: XXXXXXXXXXXXXXX
      enabled: true
    output:
      bulk_max_size: 5120
      elasticsearch.hosts: '${ELASTICSEARCH_HOST}:${ELASTICSEARCH_PORT}'
      elasticsearch.password: '${ELASTICSEARCH_PASSWORD}'
      elasticsearch.protocol: https
      elasticsearch.ssl.verification_mode: none
      elasticsearch.username: '${ELASTICSEARCH_USERNAME}'
      worker: 4
    queue.mem:
      events: 102400
      flush.min_events: 500
    setup.template.settings:
      index.number_of_replicas: 1
      index.number_of_shards: 4
      index.refresh_interval: 10s
  count: 3
  elasticsearchRef:
    name: ''
  http:
    service:
      metadata:
        creationTimestamp: null
      spec: {}
    tls:
      certificate: {}
  podTemplate:
    metadata:
      labels:
        app: elastic-apm
    spec:
      containers:
        - envFrom:
            - secretRef:
                name: elk-secrets
          name: apm-server
          readinessProbe:
            httpGet:
              path: /
              port: 8200
              scheme: HTTPS
          resources:
            limits:
              cpu: 2500m
              memory: 1.5G
            requests:
              cpu: 2000m
              memory: 800Mi
          volumeMounts:
            - mountPath: /etc/es-cert
              name: es-cert
              readOnly: true
            - mountPath: /etc/apm-cert
              name: apm-cert
              readOnly: true
      volumes:
        - name: es-cert
          secret:
            secretName: es-cert
        - name: apm-cert
          secret:
            secretName: apm-cert
  secureSettings:
    - secretName: elk-secrets
  version: 7.17.6
---
kind: HorizontalPodAutoscaler
apiVersion: autoscaling/v2beta1
metadata:
  name: elk-apm-jaeger
  namespace: elastic-apm
spec:
  scaleTargetRef:
    kind: Deployment
    name: elk-apm-jaeger-apm-server
    apiVersion: apps/v1
  minReplicas: 3
  maxReplicas: 10
  metrics:
    - type: Resource
      resource:
        name: cpu
        targetAverageUtilization: 80
    - type: Resource
      resource:
        name: memory
        targetAverageUtilization: 80

the monitoring output is here:


and

Hi @VVK,

As @axw mentioned we're not aware of any performance regressions between those two versions. I'm unsure why that's happening but looking at the provided stack monitoring screenshot that you provided, it seems worrisome that the CPU utilization is >100% for that pod. Are all pods reporting CPU utilization >100%?

If that's the case, we may need to collect some CPU profiles in order to be able to debug and diagnose further. Would you be willing to do that?
In practice we'd need to enable profiling and capture a two or three CPU, Goroutine and heap profiles.

Yes. all pods are reporting >100%
( sandbox-dev/staging/ pre-prod).

Let me upgrade, my sandbox-dev to 7.17.8.
I shall update you sooner with effects if any.

I upgraded to 7.17.8 (by changing spec.version of APMServer CRD 7.17.8) ... Still I get high cpu... please have a look.


@marclop
I would need your guidance on how to do CPU profiling, heap profiles, Goroutines..

Reason is: I am new.. and of course.. I am willing to learn. Just point me to right resources

No worries, to enable pprof profiling, you need to set apm-server.pprof.enabled: true in your APM Server configuration.

Substitute ${apm_server_url} with the APM Server real URL:

go tool pprof ${apm_server_url}/debug/pprof/profile
go tool pprof ${apm_server_url}/debug/pprof/heap
go tool pprof ${apm_server_url}/debug/pprof/goroutine

Each collected profile will be saved in your home directory in a .pb.gz file, in my machine this looks like: /Users/marclop/pprof/pprof.apm-server.alloc_objects.alloc_space.inuse_objects.inuse_space.104.pb.gz, but the naming will be different in your machine. Each profile shouldn't be bigger than a few tens of KB.

You will need to have go installed in the machine from which you're collecting the profiles.

@marclop

For how much time I should collect the data?

-vinod

I would allow the APM Server to run for a few minutes so data is flowing through it, run the commands shown above with the default values (no need to specify the seconds on the as query parameters), and then disable pprof again.

@marclop

I know... I am late, but I wish to keep thread alive.. I will publish required data soon

Question: I have files like this...
vvk@vvk reading1 % ls -lt
total 56
-rw-r--r--@ 1 vvk staff 7347 Jan 9 15:55 pprof.apm-server.samples.cpu.001.pb.gz
-rw-r--r--@ 1 vvk staff 10095 Jan 9 15:54 pprof.apm-server.alloc_objects.alloc_space.inuse_objects.inuse_space.001.pb.gz
-rw-r--r--@ 1 vvk staff 4526 Jan 9 15:53 pprof.apm-server.goroutine.001.pb.gz
vvk@vvk reading1 %

Question:
How do I send the files to you?... Is there any document repository where-in I can upload the documents?

How did I collect data:
go tool pprof -seconds 5 https+insecure://elk-apm-jaeger-apm-http.elastic-apm:8200/debug/pprof/heap
go tool pprof -seconds 5 https+insecure://elk-apm-jaeger-apm-http.elastic-apm:8200/debug/pprof/profile
go tool pprof -seconds 5 https+insecure://elk-apm-jaeger-apm-http.elastic-apm:8200/debug/pprof/goroutine

-vinod

@marclop

please check this link

with appropriate profiler output files.

Regards
vinod

@marclop

is the quality of profiler data supplied okay?

This topic was automatically closed 20 days after the last reply. New replies are no longer allowed.

Hi @VVK, I've just took a look at the profiles. One odd thing jumps out immediately:

I haven't seen runtime._ExternalCode show up in profiles in recent memory. I also notice that liboneagentgo.so is taking a not-insignificant amount of CPU -- more than the CPU used by the APM Server HTTP handlers (the tree on the right).

I suggest either disabling or reconfiguring your Dynatrace OneAgent so it doesn't instrument APM Server, and see if that makes a difference.

1 Like