May I ask you to clarify what setup of APM Server are you using?
For example, are you hosting the Elastic stack yourself or are you running it in cloud.elastic.co?
Can you also specify the versions for both the client and server part that you are using?
Cheers
I was trying to figure what's wrong and re-created a similar setup but I could not face any issues.
Can you please clarify what you mean with "one of our functions runs on graphql and transactions logged properly."?
Does this mean that you see traces data populated in the APM UI for this function?
Also when you say "Starting and ending span manually does not solve the issue", do you mean adding instrumentation in the code, in form of spans?
I guess you already validated that the environment variables needed to configure the agent are populated equally in all functions?
On the other hand, we have couple of http trigger and time trigger. Traces from them aren't appearing on APM UI.
Regarding spans. Logging traces from apm I noticed that spans for Graphql function transaction were created during it's execution (even if there are no external dependencies on the code).
On the other hand, there was no spans for http/time functions transaction. I found that this can cause a problem as transaction will not display traces if there are not spans under it.
I've tried to add spans manually by calling apm.startSpan and endSpan during code execution. Even this span appears on logs (logs from local terminal), traces for transactions are still not display on APM UI.
I've also tried locally using CommonJS modules instead of ECMAscript (from docs I noticed that can be a problem), that didn't work.
ENV variables are the same for all functions as the code start on entry point from package.json
Do you have a working copy? I want to try find the differences.
My node version is 18.20.2, tried different versions on Azure Function runtime. On main env we are using "version": "[3.*, 4.0.0)".
P.S. From the screenshot above you can see a workaround creating require for ECMAscript module. This is in order to go through the bug in apm not capturing graphql requests properly (they are displayed as regular http request but not graphql methods. require-in-the-middle needs to be executed properly, but import-in-the-middle looks to be broken).
I work on the Node.js APM agent. Are you able to show a small example with code that reproduces the issue. If you run with ELASTIC_APM_LOG_LEVEL=trace that will provide helpful details on what the APM agent is doing.
I'm a little confused on whether we are talking about tracing HTTP or Time triggered Azure Functions, or something you are able to run locally to reproduce the problem.
Traces for APM doesn't contain a lot of, the only things are:
start trace
setting default transcation name
setting transaction result
sending transaction
Share me your email if you want to have a full logs (or let me know any other way to share them with you, I don't want to post them there lmao)
Make a note, no spans created during this transaction. Manually creating spans (by apm.startSpan and endSpan) doesn't work. I except it working without any manual interactions.
P.S demo repo seems to be a little outdated. Latest npm version doesn't work either.
@shevkaboss Sorry for not having replying a long time.
In one of your messages in Aug you said:
but then in the same message said:
So I am a little confused. That does show that tracing data for this example Azure Function was captured, right?
I'm not sure what is happening with the "The selected trace cannot be found." shown in your screenshot.
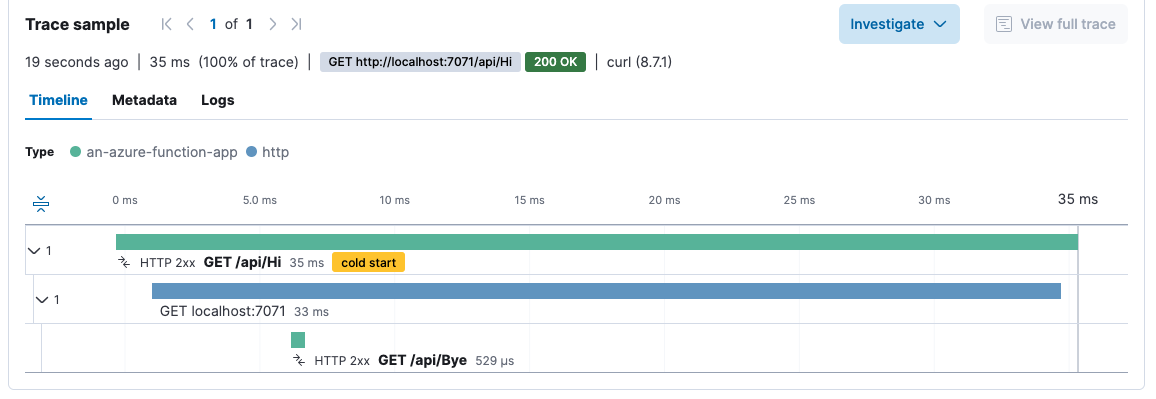
When calling GET http://localhost:7071/api/Bye I don't expect to see any spans: just the one top-level transaction. The Hi endpoint should show spans, however.
Here is my reproduction:
cd apm-agent-nodejs/examples/an-azure-function-app
nvm use 20  # I ran into an IPv6 issue using Node.js v18.
npm install
export ELASTIC_APM_SERVER_URL=...
export ELASTIC_APM_SECRET_TOKEN=...
npm start

curl http://localhost:7071/api/Hi
The func start (from npm start above) logged this:
[2025-01-16T17:30:47.290Z] Executing 'Functions.Hi' (Reason='This function was programmatically called via the host APIs.', Id=264dfc96-7a2c-4876-b7b6-aa7be19ef746)
[2025-01-16T17:30:47.311Z] Executing 'Functions.Bye' (Reason='This function was programmatically called via the host APIs.', Id=d022f079-2441-451b-ba28-b3271970dcea)
[2025-01-16T17:30:47.335Z] Executed 'Functions.Bye' (Succeeded, Id=d022f079-2441-451b-ba28-b3271970dcea, Duration=23ms)
[2025-01-16T17:30:47.342Z] Executed 'Functions.Hi' (Succeeded, Id=264dfc96-7a2c-4876-b7b6-aa7be19ef746, Duration=63ms)
@trentm thanks for reply. Yes, from your screenshot there was a big difference on what was appearing on my ELK instance.
Finally, after another round of diving deeper in this problem I found out misconfigured apm-traces@custom ingest pipeline for APM index. It was producing errors trying to read non-graphql logs which resulted in not showing transaction samples on APM UI.
Simply disabling custom ingest pipeline made everything work like a charm.
Apache, Apache Lucene, Apache Hadoop, Hadoop, HDFS and the yellow elephant
logo are trademarks of the
Apache Software Foundation
in the United States and/or other countries.