Hello,
im sniffing my mirrored traffic with packetbeat and see little amout of data on kibana.
to compare - i tcpdumped my traffic, chose a string to grep - 'quattroruote'
while running grep on tcpdump pcap file (more output.log | grep quattroruote) i get 8 different rows contains quattroruote:
Tcpdump and Packetbeat are very different tools, processing traffic in very different ways. Tcpdump reports single packets. Packetbeat reconstructs the TCP streams from the packets, parses the application layer protocols in the reconstructed streams, and correlates requests with responses into transactions. Packetbeat publishes each transaction as a single event. That is, a transaction can consist of a many packets.
Running packetbeat -h reveals the --dump <filename> option. This writes the processed packets to file. It's only for debugging and there is no log-rotation or any other limits on this file.
Maybe you will help here,
if you mind to check this issue here - https://github.com/elastic/beats/issues/6409
lots of parsing errors.
guys in the thread asked for tcpdumps which unfortunately i cannot provide due to high vol of data.
plus, based on your answer - "Tcpdump and Packetbeat are very different tools, processing traffic in very different ways"
Are you familiar with that issue?
Your issue has to be caused by some kind of malformed HTTP, I really would like to see those dumps. Can you upload the .pcap to a different service (google drive for example), and share the link here or in private message?
One problem with application layer analysis is, the analyser parsing the application layer messages must be in sync with the client/server. That is, the parser must find the start/beginning of a message in the stream. Packetbeat just tries to parse in the middle of an potentially already active TCP stream. If parsing succeeds, packetbeat knows it is in sync. If parsing fails, the connection state is thrown away and packetbeat retries, until it can sync up with the original stream of messages. Packetbeat can only create events if it is in sync with the monitored streams. Every gap (packet loss) can potentially unsync packetbeat, so it has to start over again. In this case events might not be generated.
Causes for packetbeat generating the stack-traces are: Parser is not in sync, but not robust enough to deal with parsing errors. This is not 'too' critical, but creates loads of noise in the logs. Still, the parser should be made more robust, so not to create false alarms. A second cause can be an actual bug, potentially handling malformed or correctly formatted contents.
Which sniffer type have you configured. On linux, switching to af_packet can help with packet loss.
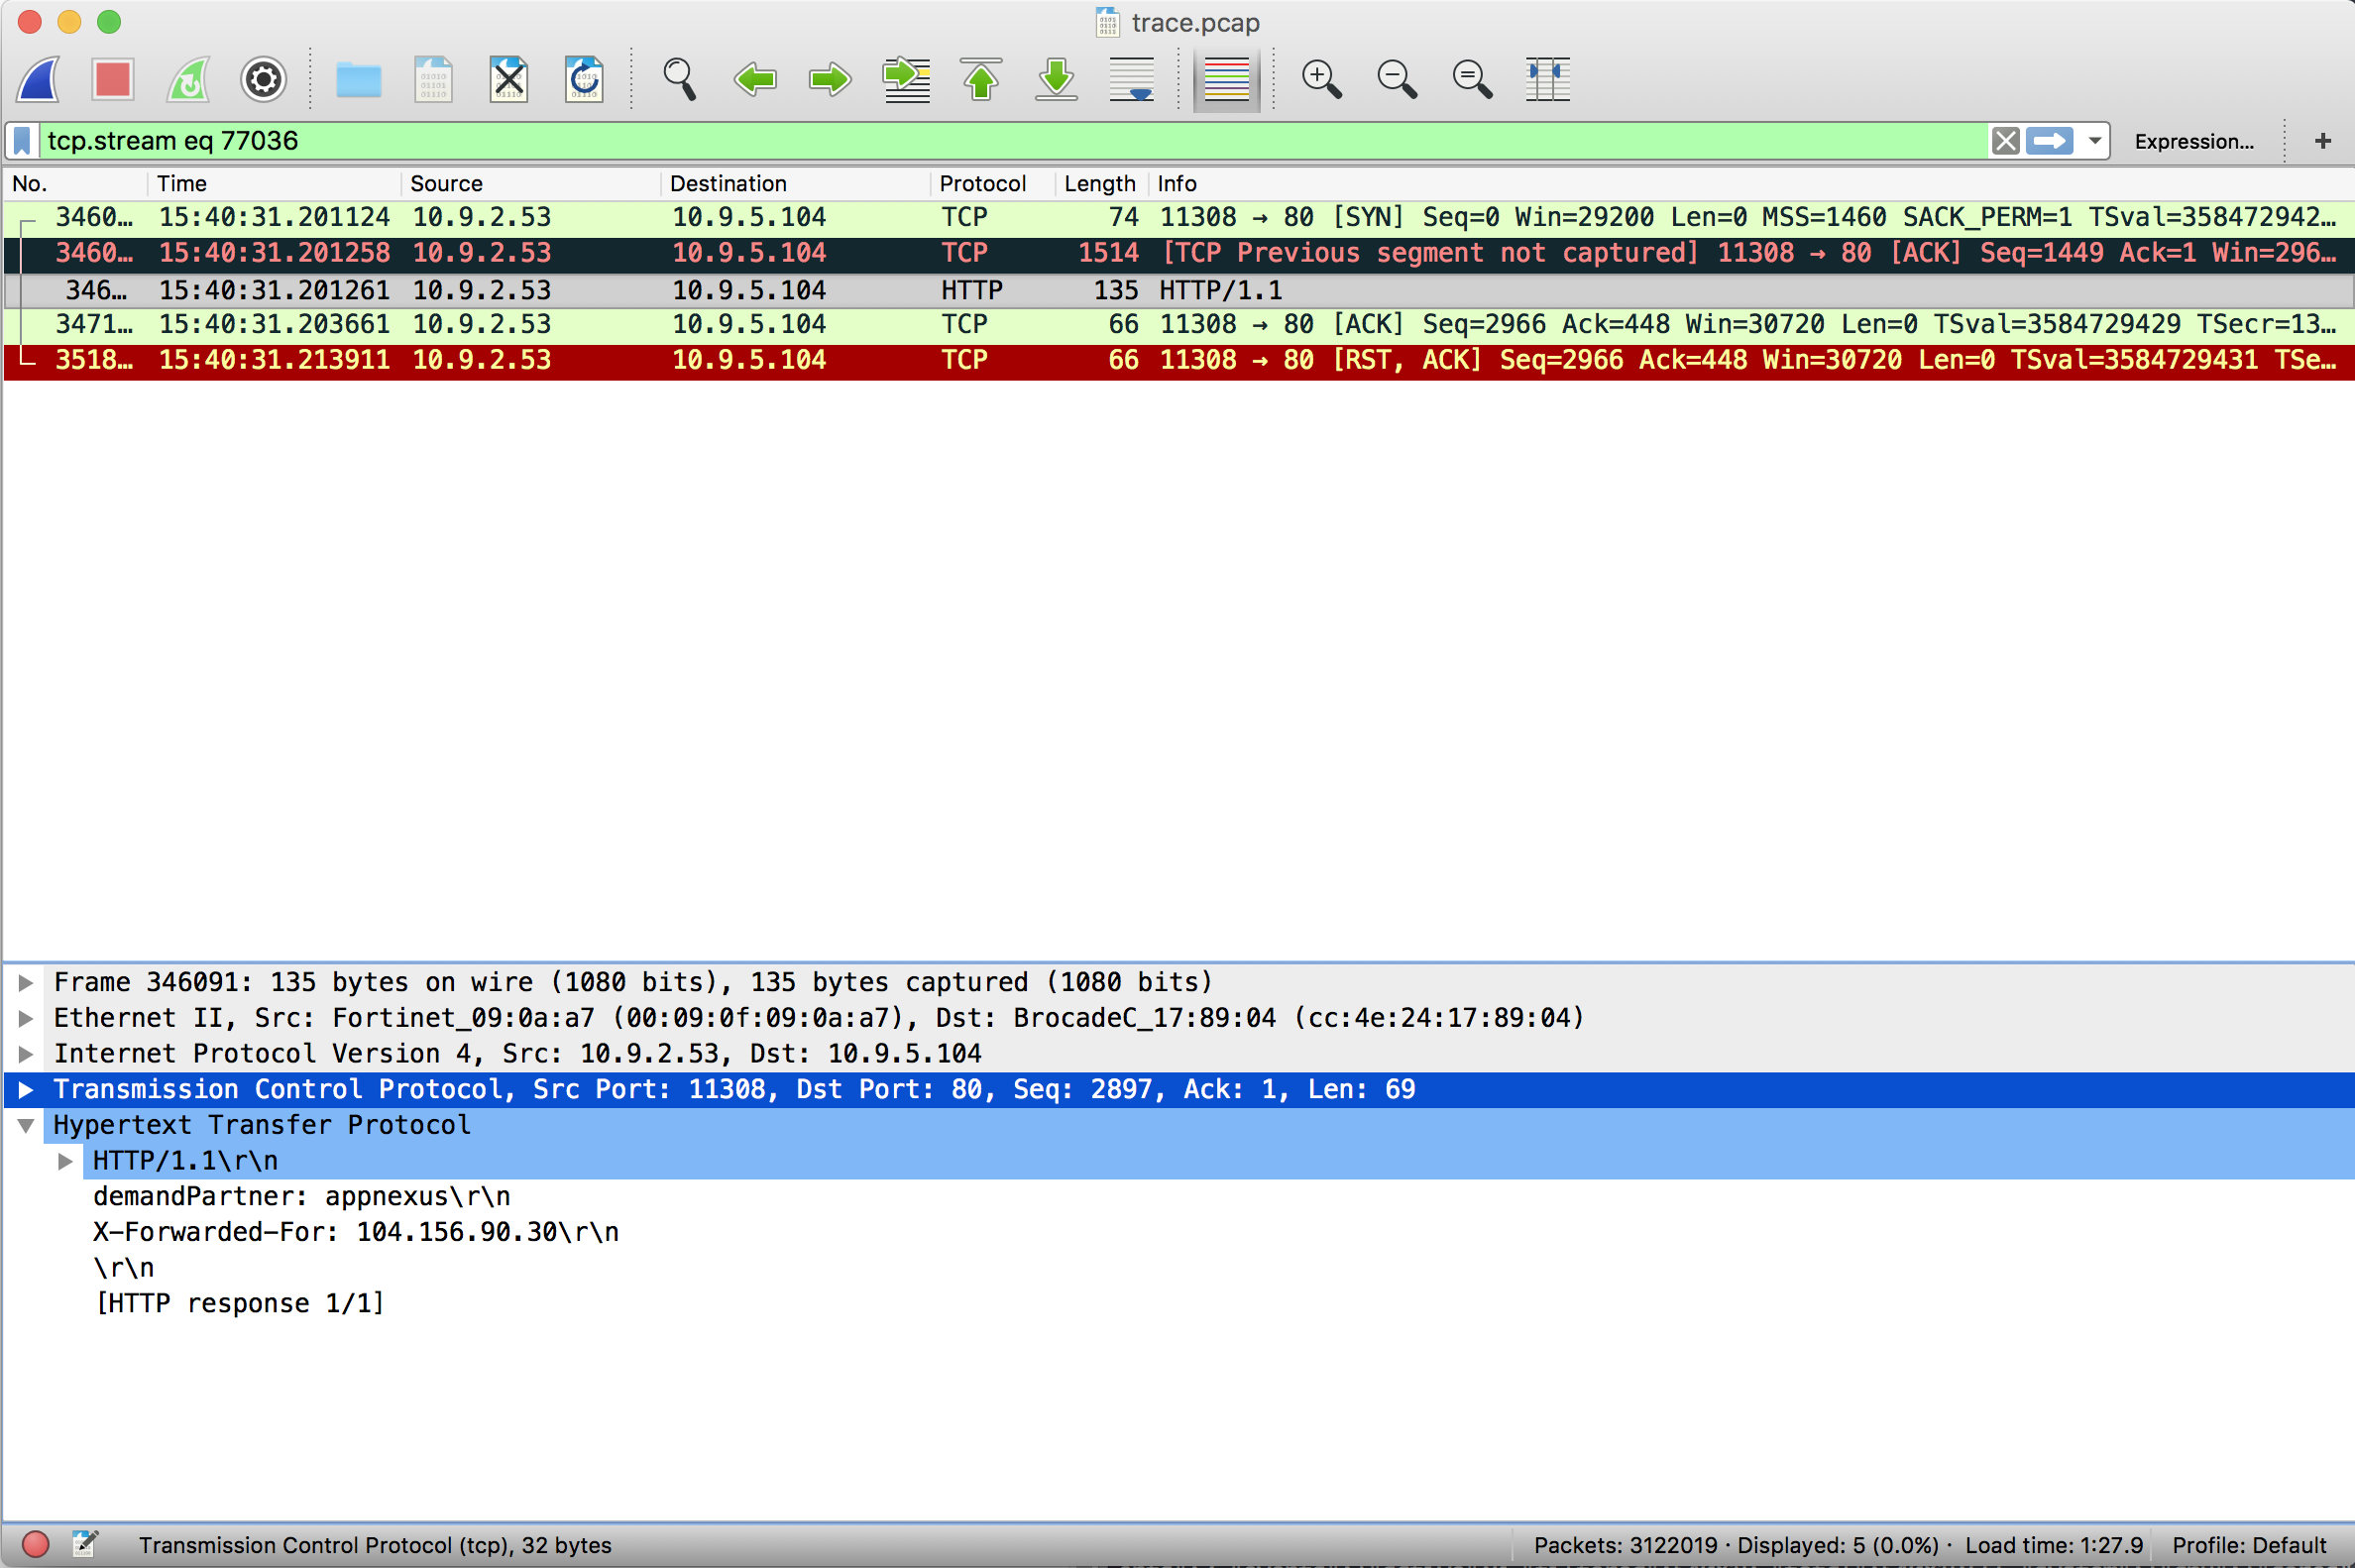
After checking it I can confirm that the problem is caused by packet loss. It's interesting how so many packets are lost causing this specific problem (everything from the response line being lost except for "HTTP/1.1\r\n"), which is triggering a panic in the http parser.
As @steffens suggested, try with af_packet sniffer.
hey guys, @adrisr@steffens
thanks for your outputs!
if you refer to the property at the yml file - packetbeat.interfaces.type: af_packet
so its already set in my yml.
Apache, Apache Lucene, Apache Hadoop, Hadoop, HDFS and the yellow elephant
logo are trademarks of the
Apache Software Foundation
in the United States and/or other countries.