Configuring php agent at the application

If you are asking about a problem you are experiencing, please use the following template, as it will help us help you. If you have a different problem, please delete all of this text :slight_smile:

TIP 1: select at least one tag that further categorizes your topic. For example server for APM Server related questions, java for questions regarding the Elastic APM Java agent, or ui for questions about the APM App within Kibana.

TIP 2: Check out the troubleshooting guide first. Not only will it help you to resolve common problems faster but it also explains in more detail which information we need before we can properly help you.

Kibana version:

7.9.2

Elasticsearch version:

7.9.2

APM Server version:

7.9.2

APM Agent language and version:

php agent 0.2

Browser version:

Chrome 85

Original install method (e.g. download page, yum, deb, from source, etc.) and version:

download page, from .tar file

Fresh install or upgraded from other version?

Fresh install

Is there anything special in your setup? For example, are you using the Logstash or Kafka outputs? Are you using a load balancer in front of the APM Servers? Have you changed index pattern, generated custom templates, changed agent configuration etc.

no, single vm for elasticsearch, kibana and apm server.

Description of the problem including expected versus actual behavior. Please include screenshots (if relevant):

Hello,

First of all sorry for the english, not my native language.

I followed the docs at the https://github.com/elastic/apm-agent-php/blob/master/docs/setup.asciidoc to install the php agent at my application, created the extension and added at the .ini file... but the data isnt being showed at my kibana UI.

Seems a dumb question but... am I missing something??? I still need to do something for the agent send data to my apm server?

thanks in advance.

Steps to reproduce:

  1. Followed PHP agent docs.
  2. restarted httpd
  3. restarted apm-server

Errors in browser console (if relevant):

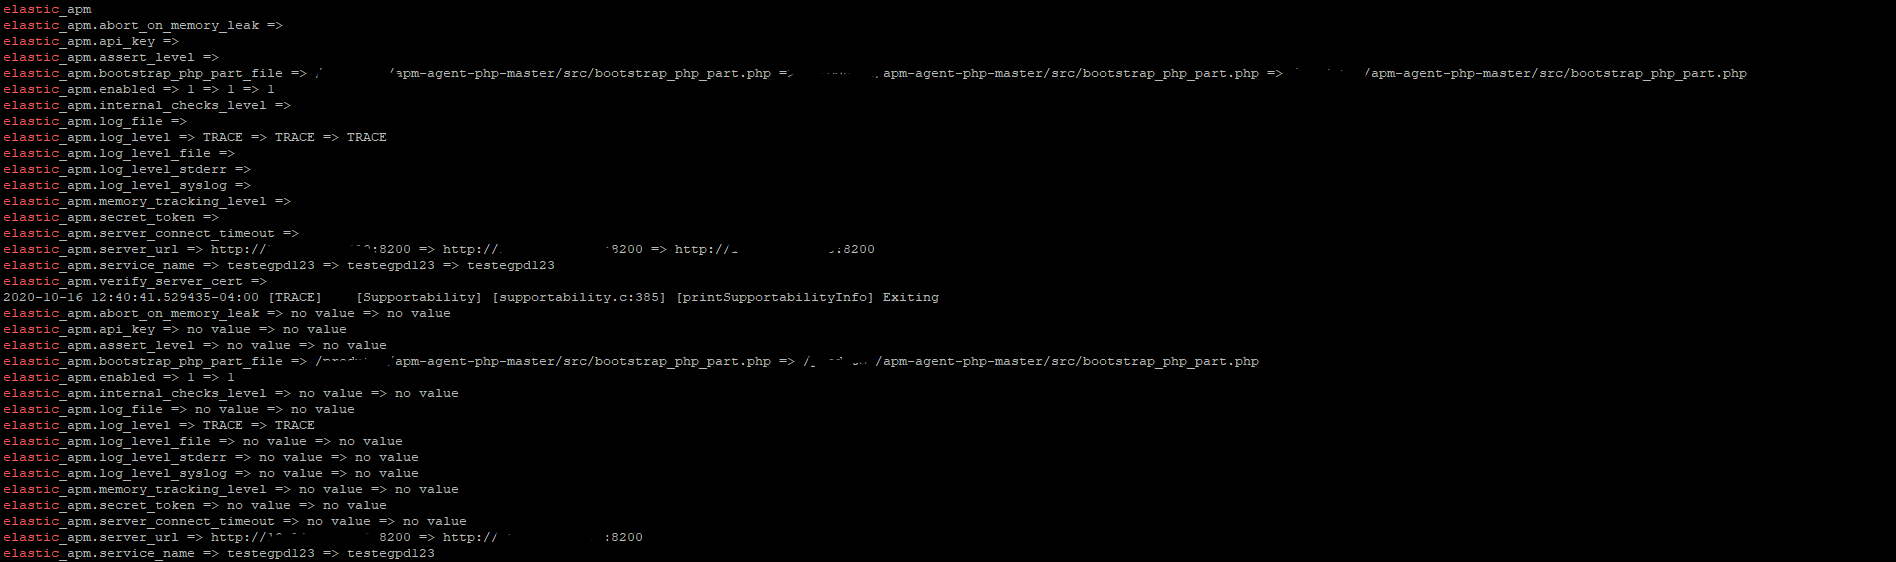
Provide logs and/or server output (if relevant):

I assembled the agent, installed it. It sends information on simple hits. But due to failures it cannot.

Server log - 404

2020-10-15T22:24:10.485+0600 ERROR [request] middleware/log_middleware.go:95 404 page not found {"request_id": "e37a92cc-4c83-42b7-a494-ed1cece443cd", "method": "POST", "URL": "/intake/v2/events/errors", "content_length": 2772, "remote_address": "127.0.0.1", "user-agent": "elasticapm-php/6.5.4", "response_code": 404, "error": "404 page not found"}

@dvmorais Welcome to the forum!

Could you please provide agent's logs? By default agent logs to syslog and you can even increase amount of logs (for example by setting agent's log level to TRACE) as described in the documentation.

@GHostlyFOX Welcome to the forum!

If you and @dvmorais are talking about different cases then please open a separate topic. For now since you've already opened a Github issue I've replied there.

What I did now:

  1. Changed agent logs to "TRACE"
  2. restarted apm-server
  3. restarted httpd.
  4. checked /var/log/messages

well... nothing related to agent appeared on the log messages...

The thing is... I cant really understand where I integrate the agent with my application... shouldnt I load the elastic_apm.so extension in php.ini or something around this? Maybe am I missing something?

thanks in advance.

Yes, you are right - elastic_apm.so needs to be added to php.ini as described in the documentation. The documentation mentions elastic_apm.ini but it should be php.ini (I'll fix it shortly).

I added these on php.ini:

extension=elastic_apm.so
elastic_apm.enabled=true
elastic_apm.server_url=http://not.localhost:8200
elastic_apm.service_name=testegpd123
elastic_apm.bootstrap_php_part_file = /directory/to/apm-agent-php/src/bootstrap_php_part.php

so... my php application is working but... my kibana still cant see any traces.

log messages:
Oct 16 11:13:48 FrontendSEE php[1913]: Elastic APM PHP Tracer [PID: 1913] [TID: 1913] 2020-10-16 11:13:48.452661-04:00 [ERROR]    [Ext-API] [elastic_apm_API.c:135] [elasticApmInterceptCallsToInternalMethod] zend_hash_str_find_ptr( CG( class_table ), ... ) failed. className: `PDO'
Oct 16 11:13:48 FrontendSEE php[1913]: Elastic APM PHP Tracer [PID: 1913] [TID: 1913] 2020-10-16 11:13:48.452733-04:00 [ERROR]    [Ext-API] [elastic_apm_API.c:135] [elasticApmInterceptCallsToInternalMethod] zend_hash_str_find_ptr( CG( class_table ), ... ) failed. className: `PDO'
Oct 16 11:14:18 FrontendSEE php[1915]: Elastic APM PHP Tracer [PID: 1915] [TID: 1915] 2020-10-16 11:14:18.330886-04:00 [ERROR]    [Ext-API] [elastic_apm_API.c:135] [elasticApmInterceptCallsToInternalMethod] zend_hash_str_find_ptr( CG( class_table ), ... ) failed. className: `PDO'
Oct 16 11:14:18 FrontendSEE php[1915]: Elastic APM PHP Tracer [PID: 1915] [TID: 1915] 2020-10-16 11:14:18.330957-04:00 [ERROR]    [Ext-API] [elastic_apm_API.c:135] [elasticApmInterceptCallsToInternalMethod] zend_hash_str_find_ptr( CG( class_table ), ... ) failed. className: `PDO'
Oct 16 11:15:10 FrontendSEE php[1918]: Elastic APM PHP Tracer [PID: 1918] [TID: 1918] 2020-10-16 11:15:10.279153-04:00 [ERROR]    [Ext-API] [elastic_apm_API.c:135] [elasticApmInterceptCallsToInternalMethod] zend_hash_str_find_ptr( CG( class_table ), ... ) failed. className: `PDO'
Oct 16 11:15:10 FrontendSEE php[1918]: Elastic APM PHP Tracer [PID: 1918] [TID: 1918] 2020-10-16 11:15:10.279240-04:00 [ERROR]    [Ext-API] [elastic_apm_API.c:135] [elasticApmInterceptCallsToInternalMethod] zend_hash_str_find_ptr( CG( class_table ), ... ) failed. className: `PDO'

Those are just erroneous/redundant log messages but there's no actual issue behind them.

The fix is already merged to master.

Built from master as you recommended. still no data.

I did some prints if it can help you to detect something wrong in what I did.

if everything is allright probably is something wrong on my application...

strangely... my phpinfo(). page stopped working after I turned on the elastic_apm extension.

<?php
phpinfo();
?>


The agent integrates with phpinfo() mechanism so it's technically possible for the agent to affect.

Could you please set log_level_syslog to TRACE and get the agent logs, that cover a request (preferably a one which execution invokes phpinfo()) from syslog?

php -i | grep elastic

elastic_apm
elastic_apm.abort_on_memory_leak =>    
elastic_apm.api_key =>    
elastic_apm.assert_level =>    
elastic_apm.bootstrap_php_part_file => /produtos/apm-agent-php-master/src/bootstrap_php_part.php => /produtos/apm-agent-php-master/src/bootstrap_php_part.php => /produtos/apm-agent-php-master/src/bootstrap_php_part.php
elastic_apm.enabled => 1 => 1 => 1
elastic_apm.internal_checks_level =>    
elastic_apm.log_file =>    
elastic_apm.log_level => TRACE => TRACE => TRACE
elastic_apm.log_level_file =>    
elastic_apm.log_level_stderr =>    
elastic_apm.log_level_syslog => TRACE => TRACE => TRACE
elastic_apm.memory_tracking_level =>    
elastic_apm.secret_token =>    
elastic_apm.server_connect_timeout =>    
elastic_apm.server_url => http://10.14.210.210:8200 => http://10.14.210.210:8200 => http://10.14.210.210:8200
elastic_apm.service_name => testegpd12345 => testegpd12345 => testegpd12345
elastic_apm.verify_server_cert =>    
elastic_apm.abort_on_memory_leak => no value => no value
elastic_apm.api_key => no value => no value
elastic_apm.assert_level => no value => no value
elastic_apm.bootstrap_php_part_file => /produtos/apm-agent-php-master/src/bootstrap_php_part.php => /produtos/apm-agent-php-master/src/bootstrap_php_part.php
elastic_apm.enabled => 1 => 1
elastic_apm.internal_checks_level => no value => no value
elastic_apm.log_file => no value => no value
elastic_apm.log_level => TRACE => TRACE
elastic_apm.log_level_file => no value => no value
elastic_apm.log_level_stderr => no value => no value
elastic_apm.log_level_syslog => TRACE => TRACE
elastic_apm.memory_tracking_level => no value => no value
elastic_apm.secret_token => no value => no value
elastic_apm.server_connect_timeout => no value => no value
elastic_apm.server_url => http://10.14.210.210:8200 => http://10.14.210.210:8200
elastic_apm.service_name => testegpd12345 => testegpd12345
elastic_apm.verify_server_cert => no value => no value

last 3 lines from /var/log/messages

Oct 16 15:10:20 FrontendSEE dnf[6604]: Criado cache de metadados
Oct 16 15:10:20 FrontendSEE systemd[1]: Started dnf makecache.
Oct 16 15:13:08 FrontendSEE systemd-logind[1064]: Removed session 21.
info.php

<?php
phpinfo();
?>

Could you please provide all the lines from syslog that contain Elastic APM PHP Tracer?

Oct 16 11:13:48 FrontendSEE php[1913]: Elastic APM PHP Tracer [PID: 1913] [TID: 1913] 2020-10-16 11:13:48.452661-04:00 [ERROR]    [Ext-API] [elastic_apm_API.c:135] [elasticApmInterceptCallsToInternalMethod] zend_hash_str_find_ptr( CG( class_table ), ... ) failed. className: `PDO'
Oct 16 11:13:48 FrontendSEE php[1913]: Elastic APM PHP Tracer [PID: 1913] [TID: 1913] 2020-10-16 11:13:48.452733-04:00 [ERROR]    [Ext-API] [elastic_apm_API.c:135] [elasticApmInterceptCallsToInternalMethod] zend_hash_str_find_ptr( CG( class_table ), ... ) failed. className: `PDO'
Oct 16 11:14:18 FrontendSEE php[1915]: Elastic APM PHP Tracer [PID: 1915] [TID: 1915] 2020-10-16 11:14:18.330886-04:00 [ERROR]    [Ext-API] [elastic_apm_API.c:135] [elasticApmInterceptCallsToInternalMethod] zend_hash_str_find_ptr( CG( class_table ), ... ) failed. className: `PDO'
Oct 16 11:14:18 FrontendSEE php[1915]: Elastic APM PHP Tracer [PID: 1915] [TID: 1915] 2020-10-16 11:14:18.330957-04:00 [ERROR]    [Ext-API] [elastic_apm_API.c:135] [elasticApmInterceptCallsToInternalMethod] zend_hash_str_find_ptr( CG( class_table ), ... ) failed. className: `PDO'
Oct 16 11:15:10 FrontendSEE php[1918]: Elastic APM PHP Tracer [PID: 1918] [TID: 1918] 2020-10-16 11:15:10.279153-04:00 [ERROR]    [Ext-API] [elastic_apm_API.c:135] [elasticApmInterceptCallsToInternalMethod] zend_hash_str_find_ptr( CG( class_table ), ... ) failed. className: `PDO'
Oct 16 11:15:10 FrontendSEE php[1918]: Elastic APM PHP Tracer [PID: 1918] [TID: 1918] 2020-10-16 11:15:10.279240-04:00 [ERROR]    [Ext-API] [elastic_apm_API.c:135] [elasticApmInterceptCallsToInternalMethod] zend_hash_str_find_ptr( CG( class_table ), ... ) failed. className: `PDO'

this is the messages before I built the extension from master. so.... no new logs.

This topic was automatically closed 20 days after the last reply. New replies are no longer allowed.