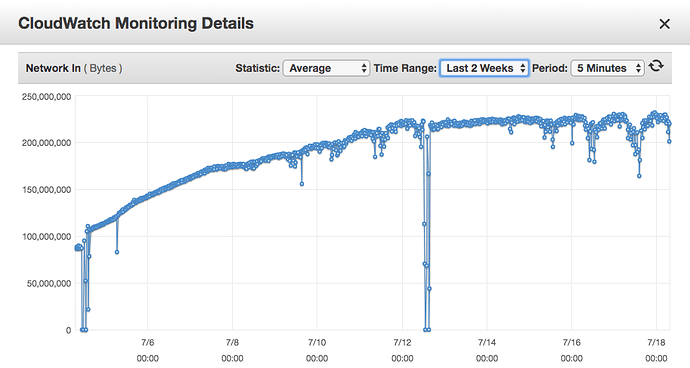
Working on infrastructure built over AWS, since there are some special cases that logs are stored only in S3 buckets, if we want to use ELK to analyse these logs, we need to use 'S3 Input plugin' [1].
Unfortunately, the CPU usage of 'logstash' process is very, very high and also the Incoming network load [Network in] is very high, if we will take in count that we have 'sincedb_path' in use.

On the picture above, it is possible to see, that after I add S3 Access logs (they are from 5/7/2019 also analysed with/sent to ELK), the 'Network In' load is growing daily. To me it seems like the S3 input plugin is scanning whole bucket of S3 Access logs (logs of S3 Access log appears like one line in separate file - so there is quite huge number of files, in that S3 bucket).
Currently we are using 16x S3 input plugin in logstash.conf (in the input part) - please, see example of configuration below*.
input
{
    s3
    {
        bucket => "<bucket_name>"
        prefix => "production/lb/<path>/elasticloadbalancing/eu-west-1/"
        region => "eu-west-1"
        type => "alblogs"
        codec => plain
        sincedb_path => "/opt/<path>/elasticsearch/plugins/repository-s3/alblogs.txt"
        secret_access_key => "<secret>"
        access_key_id => "<access_key_id>"
    }

...

 filter {
   if [type] == "alblogs" {
      grok {
         match => ["message", "%{TIMESTAMP_ISO8601:timestamp} %{NOTSPACE:loadbalancer} %{IP:client_ip}:%{NUMBER:client_port:int} (?:%{IP:backend_ip}:%{NUMBER:backend_port:int}|-) %{NUMBER:request_processing_time:float} %{NUMBER:backend_processing_time:float} %{NUMBER:response_processing_time:float} (?:%{NUMBER:elb_status_code:int}|-) (?:%{NUMBER:backend_status_code:int}|-) %{NUMBER:received_bytes:int} %{NUMBER:sent_bytes:int} \"(?:%{WORD:verb}|-) (?:%{GREEDYDATA:request}|-) (?:HTTP/%{NUMBER:httpversion}|-( )?)\" \"%{DATA:userAgent}\"( %{NOTSPACE:ssl_cipher} %{NOTSPACE:ssl_protocol})?"]
        match => [ "request", "%{UUID:event_uuid}" ]
      }

...

  if [type] == "s3_production" {
    grok {
        match => ["message", "%{NOTSPACE:s3_owner}[ \t](-|%{HOSTNAME:s3_bucket})[ \t]\[%{HTTPDATE:timestamp}\][ \t]%{IP:s3_remote_ip}[ \t]%{NOTSPACE:Requester}[ \t]%{NOTSPACE:RequesterID}[ \t]%{NOTSPACE:s3_operation}[ \t]%{NOTSPACE:s3_key}[ \t]%{NOTSPACE:request_method}[ \t]%{NOTSPACE:request_url}[ \t]%{NOTSPACE:request_protocol}[ \t]%{NUMBER:HTTP_status}[ \t]%{NOTSPACE:s3_errorCode}[ \t]%{NOTSPACE:s3_bytesSent}[ \t]%{NOTSPACE:s3_objectSize}[ \t]%{NUMBER:s3_totalTime}[ \t]%{NOTSPACE:s3_turnaroundTime}[ \t]\"%{NOTSPACE:Referrer}\"[ \t]\"%{GREEDYDATA:UserAgent}\"[ \t]%{NOTSPACE:s3_versionId}[ \t]%{NOTSPACE:s3_hostId}[ \t]%{NOTSPACE:s3_signarureVersion}[ \t]%{NOTSPACE:s3_cipherSuite}[ \t]%{NOTSPACE:s3_authType}[ \t]%{HOSTNAME:s3_hostHeader}[ \t]%{NOTSPACE:s3_TLSversion}"]

    add_tag => [ "production" ]
    tag_on_failure => [ "S3.EXPIRE.OBJECT" ]
    }
    mutate {
        remove_field => [ "message" ]
    }
  }

...

output
{

   if [type] == "alblogs" {
    elasticsearch {
        hosts => ["127.0.0.1:9200"]
        index => "alblogs-%{+YYYY.MM.dd}"
       }
   if [type] == "s3_production" {
    elasticsearch {
        hosts => ["127.0.0.1:9200"]
        index => "s3-production-%{+YYYY.MM.dd}"
       }
    }
Some advise, please? Is it normal? Could somebody please help?
*The parsing (grok) doesn't seems to be the issue. I tried to optimalize it as I could.
[1] https://www.elastic.co/guide/en/logstash/current/plugins-inputs-s3.html
