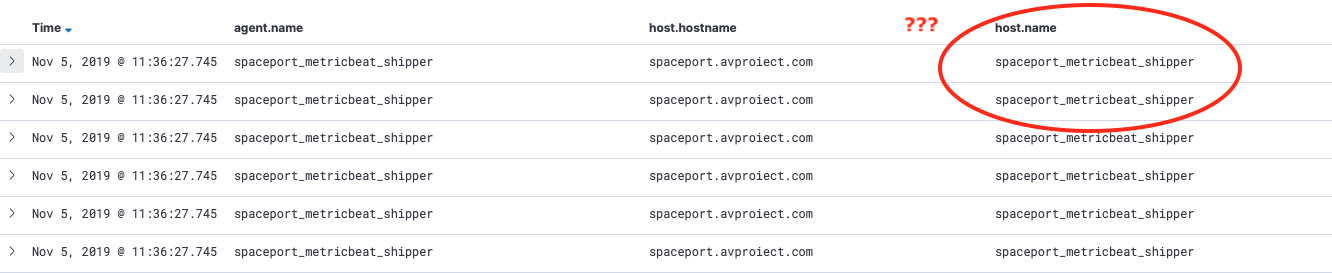
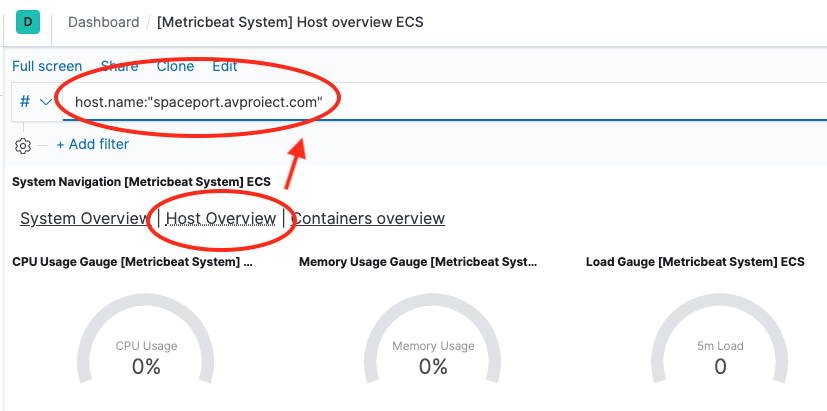
This behaviour is annoying, because if I click in the dashboard on "System Overview" it will use the query:
host.name = "spaceport.avproiect.com"
and no data (does not work obviously because host.name is somehow set to agent.name)
Hello, sorry for the late response. Did you try running metricbeat without specifying the name of the shipper in metricbeat.yml? So under General session of your metricbeat.yml, it will look like:
#================================ General =====================================

# The name of the shipper that publishes the network data. It can be used to group
# all the transactions sent by a single shipper in the web interface.
#name:

# The tags of the shipper are included in their own field with each
# transaction published.
tags: ["spaceport", "avp"]

# Optional fields that you can specify to add additional information to the
# output.
fields:
  env: staging
Based on documentation of host.name field:
It can contain what hostname returns on Unix systems, the fully qualified domain name, or a name specified by the user. The sender decides which value to use.
Hello, yes indeed. When it agent name was left empty it will display the hostname in Kibana. However I wanted to be able to have both agent_name and hostname in Kibana for visualisations.
Apache, Apache Lucene, Apache Hadoop, Hadoop, HDFS and the yellow elephant
logo are trademarks of the
Apache Software Foundation
in the United States and/or other countries.