Elastic Agent with ECK deployed stack - Fleet Manager problems

Hi,

I'm trying to test the new Elastic Agent on a ECK deployed stack with security enabled, so Elastic Agent ca work with it.

My yaml files:

elasticsearch.yaml

apiVersion: elasticsearch.k8s.elastic.co/v1
kind: Elasticsearch
metadata:
  name: elasticsearch
spec:
  version: 7.9.0
  nodeSets:
  - name: default
    count: 1
    config:
      node.master: true
      node.data: true
      node.ingest: true
    podTemplate:
      metadata:
        labels:
          app: elasticsearch
      spec:
        initContainers:
        - name: sysctl
          securityContext:
            privileged: true
          command: ['sh', '-c', 'sysctl -w vm.max_map_count=262144']
        containers:
        - name: elasticsearch
          resources:
            requests:
              memory: 2Gi
              cpu: 0.5
            limits:
              memory: 2Gi
              cpu: 1
          env:
          - name: ES_JAVA_OPTS
            value: "-Xms1g -Xmx1g"
  http:
    service:
      spec:
        type: LoadBalancer
    tls:
      selfSignedCertificate:
        subjectAltNames:
        - ip: 10.11.0.246
        - dns: elk-k3s

kibana.yaml

apiVersion: kibana.k8s.elastic.co/v1
kind: Kibana
metadata:
  name: kibana
spec:
  version: 7.9.0
  count: 1
  elasticsearchRef:
    name: "elasticsearch"
  secureSettings:
  - secretName: kibana-saved-objects-encrypted-key
  http:
    service:
      spec:
        type: LoadBalancer
    tls:
      selfSignedCertificate:
        subjectAltNames:
        - ip: 10.11.0.246
        - dns: elk-k3s
  podTemplate:
    metadata:
      labels:
        app: kibana
    spec:
      containers:
      - name: kibana
        resources:
          limits:
            memory: 2Gi
            cpu: 2

This configuration is working right for testing some features, but I have problems testing Elastic Agent.

The Agent Configuration:

The Fleet Enrollment token:

Ingest Manager settings:


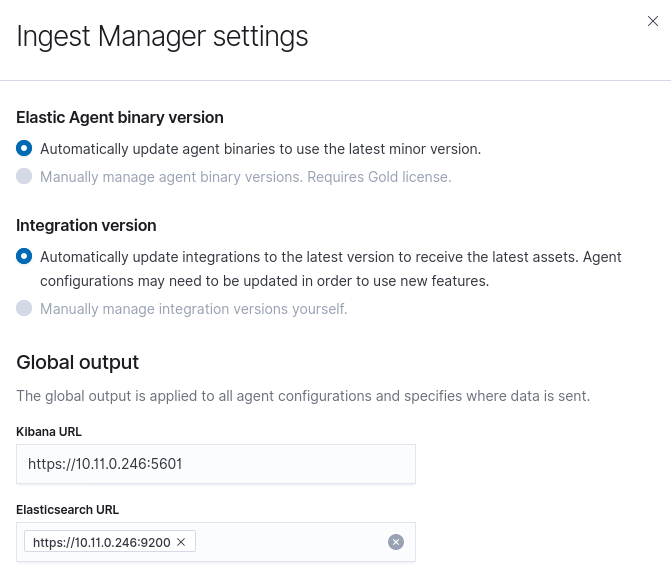
Is not clear for me here what are the correct values to use for "Kibana URL" and "Elasticsearch URL" when I'm using a ECK deployed stack. Both ElasticSearch and Kibana are exposed to outside Kubernetes Cluster in their original ports, 9200 and 5601 (the cluster have only one Kubernetes Node), with Security Enabled. And that is a main question for me: I supposed that the Elastic Agent is enrolling it to Kibana Fleet using the Fleet installation token, but how is the Elastic Agent connecting to ElasticSearch and Kibana to send logs, being that ElasticSearch and Kibana need user and password authentication?

I'm registering the Elastic Agent with the "Enroll and Fleet" instructions (with --insecure flag, because the certificate is self signed), in the same host where I have deployed ELK stack with ECK, but outside Kubernetes, in the host directly, installed the deb package, for testing:

elastic-agent enroll --insecure https://10.11.0.246:5601 *bigsecrettokenfromenrollmenttokens*
systemctl enable elastic-agent
systemctl start elastic-agent

After run these tree commands, I see the agent Running for a while, but after aprox a minute, the agent go Offline, even after restarting the service with "systemctl restart elastic-agent" (I see "Offline" in Fleet Kibana page only, even the elastic-agent service at OS level is running):


I don't see any in Datasets:

Running a "journalctl -u elastic-agent" in the OS (Ubuntu 20.04) I see:

Aug 28 18:38:34 elk-k3s elastic-agent[2664321]: 2020-08-28T18:38:34.441Z        DEBUG        application/fleet_gateway.go:162        FleetGateway is sleeping, next update in 1s
Aug 28 18:38:35 elk-k3s elastic-agent[2664321]: 2020-08-28T18:38:35.463Z        DEBUG        application/fleet_gateway.go:142        FleetGateway calling Checkin API
Aug 28 18:38:35 elk-k3s elastic-agent[2664321]: 2020-08-28T18:38:35.468Z        DEBUG        kibana/client.go:170        Request method: POST, path: /api/ingest_manager/fleet/agents/529228ed-7c5b-437c-8330-4a471d7b2ca2/checkin
root@elk-k3s:/var/log/elastic-agent# tail elasticagent.txt 
Aug 28 18:38:34 elk-k3s elastic-agent[2664321]: 2020-08-28T18:38:34.118Z        DEBUG        kibana/client.go:170        Request method: POST, path: /api/ingest_manager/fleet/agents/529228ed-7c5b-437c-8330-4a471d7b2ca2/checkin
Aug 28 18:38:34 elk-k3s elastic-agent[2664321]: 2020-08-28T18:38:34.431Z        DEBUG        application/action_dispatcher.go:81        Dispatch 1 actions of types: *fleetapi.ActionConfigChange
Aug 28 18:38:34 elk-k3s elastic-agent[2664321]: 2020-08-28T18:38:34.432Z        DEBUG        application/handler_action_policy_change.go:23        handlerConfigChange: action 'action_id: fe39f6ea-e567-4592-9bf9-0b30621585ec, type: CONFIG_CHANGE' received
Aug 28 18:38:34 elk-k3s elastic-agent[2664321]: 2020-08-28T18:38:34.438Z        DEBUG        application/handler_action_policy_change.go:34        handlerConfigChange: emit configuration for action action_id: fe39f6ea-e567-4592-9bf9-0b30621585ec, type: CONFIG_CHANGE
Aug 28 18:38:34 elk-k3s elastic-agent[2664321]: 2020-08-28T18:38:34.439Z        DEBUG        application/emitter.go:39        Transforming configuration into a tree
Aug 28 18:38:34 elk-k3s elastic-agent[2664321]: 2020-08-28T18:38:34.439Z        DEBUG        application/action_dispatcher.go:93        Failed to dispatch action 'action_id: fe39f6ea-e567-4592-9bf9-0b30621585ec, type: CONFIG_CHANGE', error: could not create the AST from the configuration: missing field accessing 'inputs'
Aug 28 18:38:34 elk-k3s elastic-agent[2664321]: 2020-08-28T18:38:34.440Z        ERROR        application/fleet_gateway.go:159        failed to dispatch actions, error: could not create the AST from the configuration: missing field accessing 'inputs'
Aug 28 18:38:34 elk-k3s elastic-agent[2664321]: 2020-08-28T18:38:34.441Z        DEBUG        application/fleet_gateway.go:162        FleetGateway is sleeping, next update in 1s
Aug 28 18:38:35 elk-k3s elastic-agent[2664321]: 2020-08-28T18:38:35.463Z        DEBUG        application/fleet_gateway.go:142        FleetGateway calling Checkin API
Aug 28 18:38:35 elk-k3s elastic-agent[2664321]: 2020-08-28T18:38:35.468Z        DEBUG        kibana/client.go:170        Request method: POST, path: /api/ingest_manager/fleet/agents/529228ed-7c5b-437c-8330-4a471d7b2ca2/checkin

The fleet.yml created by the enroll process:

agent:
  id: 529228ed-7c5b-437c-8330-4a471d7b2ca2
fleet:
  enabled: true
  access_api_key: *bigsecrettokenfromenrollmenttokens*
  kibana:
    protocol: https
    host: 10.11.0.246:5601
    timeout: 1m30s
    ssl:
      verification_mode: none
      renegotiation: never
  reporting:
    threshold: 10000
    check_frequency_sec: 30
  agent:
    id: ""

The elastic-agent.yml created by the enroll process:

fleet:
  enabled: true

At my understanding, even if the "Kibana URL" and "Elasticsearch URL" URLs are not the correct ones (please help me with this information too if you can), the Fleet Manager is not "pushing" the right configuration to the agent, but is not clear for me why.

Can anybody point me in the right direction to solve this issue? Because I really need and want to test the new Elastic Agent, mostly the EndPoint Security Feature.

Thanks in advance.

Regards,
Alejandro

An Update:

The only way I can make the Elastic Agent works, is running from the command line with:

./elastic-agent run

With the elastic-agent.yml file copied from the "Standalone mode" Add agent part of Kibana, changing the username and password in the elastic-agent.yml file for ElasticSearch with the correct ones.

But, is not working if I run elastic-agent as a service, with "systemctl start elastic-agent", using the same elastic-agent.yml file copied to /etc/elastic-agent.

Even working this way, I'm seeing constantly this in elastic-agent.log:

|2020-08-28T19:54:09.591Z|DEBUG|application/periodic.go:60|Adding 1 file to watch|
|---|---|---|---|
|2020-08-28T19:54:09.592Z|INFO|application/periodic.go:76|Configuration changes detected|
|2020-08-28T19:54:09.592Z|DEBUG|application/periodic.go:82|Updated 1 files: /usr/share/elastic-agent/bin/elastic-agent.yml|
|2020-08-28T19:54:09.603Z|DEBUG|application/emitter.go:39|Transforming configuration into a tree|
|2020-08-28T19:54:09.603Z|DEBUG|application/periodic.go:40|Failed to read configuration, error: could not emit configuration: could not create the AST from the configuration: missing field accessing 'inputs' (source:'/usr/share/elastic-agent/bin/elastic-agent.yml')|

But the "inputs" is present in elastic-agent.yml file...

Thanks in advance.

Regards,
Alejandro

As agent is still in beta we are still working on supporting it in ECK. You can follow the progress here Investigate Elastic Agent · Issue #3201 · elastic/cloud-on-k8s · GitHub

This comment also contains a sample manifest how to deploy the Agent on k8s directly. But please be aware that there are currently still a number of restrictions (no autodiscover, certificate issues).

You should use the same URLs that you normally use to access your Elasticsearch installation, as you are exposing the Elasticsearch k8s service via LoadBalancer the IP address of the LB seem fine, if you setup DNS for the LB that should work too.

I am not sure about the configuration error you saw, maybe that is something to ask in the Observability channel in this forum.

Thanks Peter for your answers.

The only doubt that I still have after read your comments is where I can config the ElasticSearch usarname/password (or even better a token to connect Elastic Agent to ElasticSearch) if I use Fleet to deploy config to Elastic Agents, because in the "Ingest Manager Settings" I only can write a URL for ElasticSearch, not credentials. I have the same doubt for Kibana, but I think the Fleet is using the token that used before for agent registration in Kibana, right?

Sorry if my questions are not clear, I'm not a native english speaker. Please let me know if something is not understood, and I can try to write the question with different words.

Thanks in advance for your help.

Regards,
Alejandro

Elastic Agent is using API keys to authenticate against Elasticsearch, this happens transparently you don't need to configure anything.

Hi Peter. Thanks againg for your new answer.

First, an update:

  • Using Windows Elastic-Agent, I don't have the problem of the agent becaming offline suddenly after 30 seconds/1 minute of enrolling, the Elastic Agent stays online for Windows agent on Fleet page, so I think the problem with Elastic-Agent DEB based for Linux maybe is only for that platform.

I don't know if the problem is that I' m using the ECK version on Kubernetes of ELK Stack at this time, but no Datasets are beeing generating from this Windows host.

The default options on Ingest Manager Settings after a fresh ECK ELK install are:
Kibana URL: https://10.11.0.246:5601, which sounds correct to me.
Elasticsearch URL: http://localhost:9200, which not sounds correct to me, but you told me this:

Reviewing the filebeat_monitor-json.log of Elastic-Agent, I can see:

{"log.level":"error","@timestamp":"2020-09-04T12:49:47.529-0300","log.logger":"publisher_pipeline_output","log.origin":{"file.name":"pipeline/output.go","file.line":154},"message":"Failed to connect to backoff(elasticsearch(http://localhost:9200)): Get \"http://localhost:9200\": dial tcp [::1]:9200: connectex: No connection could be made because the target machine actively refused it.","ecs.version":"1.5.0"}
{"log.level":"info","@timestamp":"2020-09-04T12:49:47.530-0300","log.logger":"publisher_pipeline_output","log.origin":{"file.name":"pipeline/output.go","file.line":145},"message":"Attempting to reconnect to backoff(elasticsearch(http://localhost:9200)) with 1 reconnect attempt(s)","ecs.version":"1.5.0"}
{"log.level":"debug","@timestamp":"2020-09-04T12:49:47.530-0300","log.logger":"esclientleg","log.origin":{"file.name":"eslegclient/connection.go","file.line":290},"message":"ES Ping(url=http://localhost:9200)","ecs.version":"1.5.0"}

After saw that on the logs, I changed Elasticsearch URL on Ingest Manager Settings to https://10.11.0.246:9200, which sounds the correct one to me.

A note here is that, after I change that value, the Fleet Manager didn't update that value for the already enrolled Elastic-Agent, so I need to unenroll and enroll again the Elastic-Agent.

After the re-enrolling, now the logs of filebeat_monitor-json.log ar showing this:

{"log.level":"debug","@timestamp":"2020-09-04T14:20:58.799-0300","log.logger":"esclientleg","log.origin":{"file.name":"eslegclient/connection.go","file.line":294},"message":"Ping request failed with: Get \"https://10.11.0.246:9200\": x509: certificate signed by unknown authority","ecs.version":"1.5.0"}
{"log.level":"error","@timestamp":"2020-09-04T14:21:56.630-0300","log.logger":"publisher_pipeline_output","log.origin":{"file.name":"pipeline/output.go","file.line":154},"message":"Failed to connect to backoff(elasticsearch(https://10.11.0.246:9200)): Get \"https://10.11.0.246:9200\": x509: certificate signed by unknown authority","ecs.version":"1.5.0"}
{"log.level":"info","@timestamp":"2020-09-04T14:21:56.630-0300","log.logger":"publisher_pipeline_output","log.origin":{"file.name":"pipeline/output.go","file.line":145},"message":"Attempting to reconnect to backoff(elasticsearch(https://10.11.0.246:9200)) with 37 reconnect attempt(s)","ecs.version":"1.5.0"}

Then, I tried to import the ca.crt of Elasticsearch service on the Windows Machine Certificate Truststore where I deployed the Elastic-Agent. After that, the new error message is this one:

{"log.level":"error","@timestamp":"2020-09-04T14:48:10.543-0300","log.logger":"publisher_pipeline_output","log.origin":{"file.name":"pipeline/output.go","file.line":154},"message":"Failed to connect to backoff(elasticsearch(https://10.11.0.246:9200)): Get \"https://10.11.0.246:9200\": x509: certificate is valid for 10.11.0.246, not 10.11.0.246","ecs.version":"1.5.0"}
{"log.level":"info","@timestamp":"2020-09-04T14:48:10.543-0300","log.logger":"publisher_pipeline_output","log.origin":{"file.name":"pipeline/output.go","file.line":145},"message":"Attempting to reconnect to backoff(elasticsearch(https://10.11.0.246:9200)) with 12 reconnect attempt(s)","ecs.version":"1.5.0"}
{"log.level":"debug","@timestamp":"2020-09-04T14:48:10.543-0300","log.logger":"esclientleg","log.origin":{"file.name":"eslegclient/connection.go","file.line":290},"message":"ES Ping(url=https://10.11.0.246:9200)","ecs.version":"1.5.0"}
{"log.level":"debug","@timestamp":"2020-09-04T14:48:10.573-0300","log.logger":"esclientleg","log.origin":{"file.name":"eslegclient/connection.go","file.line":294},"message":"Ping request failed with: Get \"https://10.11.0.246:9200\": x509: certificate is valid for 10.11.0.246, not 10.11.0.246","ecs.version":"1.5.0"}

Which sounds really crazy for me, mainly the part that say "certificate is valid for 10.11.0.246, not 10.11.0.246" :expressionless:

The other strange part, is that after the last change (added manually the CA on Windows Truststore), now I have Datasets, but only for EndPoint Security:

So, my conclusions:

  • If I'm using a self signed certificate, I need to add the ca.crt to Certificate Trustore, in this case Windows.
  • The Beats collectors are not working at this moment. In all the beats logs (filebeat and metricbeat in this case), I'm seeing the same message, "certificate is valid for 10.11.0.246, not 10.11.0.246"

Do you have any workaround here for Beats to collect?

Thanks for all your help.

Regards,
Alejandro

This was referring to username and password. You will have to configure the correct endpoint in Ingest Manager.

I don't have a workaround for your other issues at this point. As I said we are still working on supporting Agent on ECK ourselves. And as I mentioned before there are known issues around handling of self-signed certificates right now. You probably would have to do some debugging with openssl to see what certificates are presented and why they are considered different.