Original install method (e.g. download page, yum, deb, from source, etc.) and version:
**Fresh install **
**Nothing special hire we are using default setting as per the document **
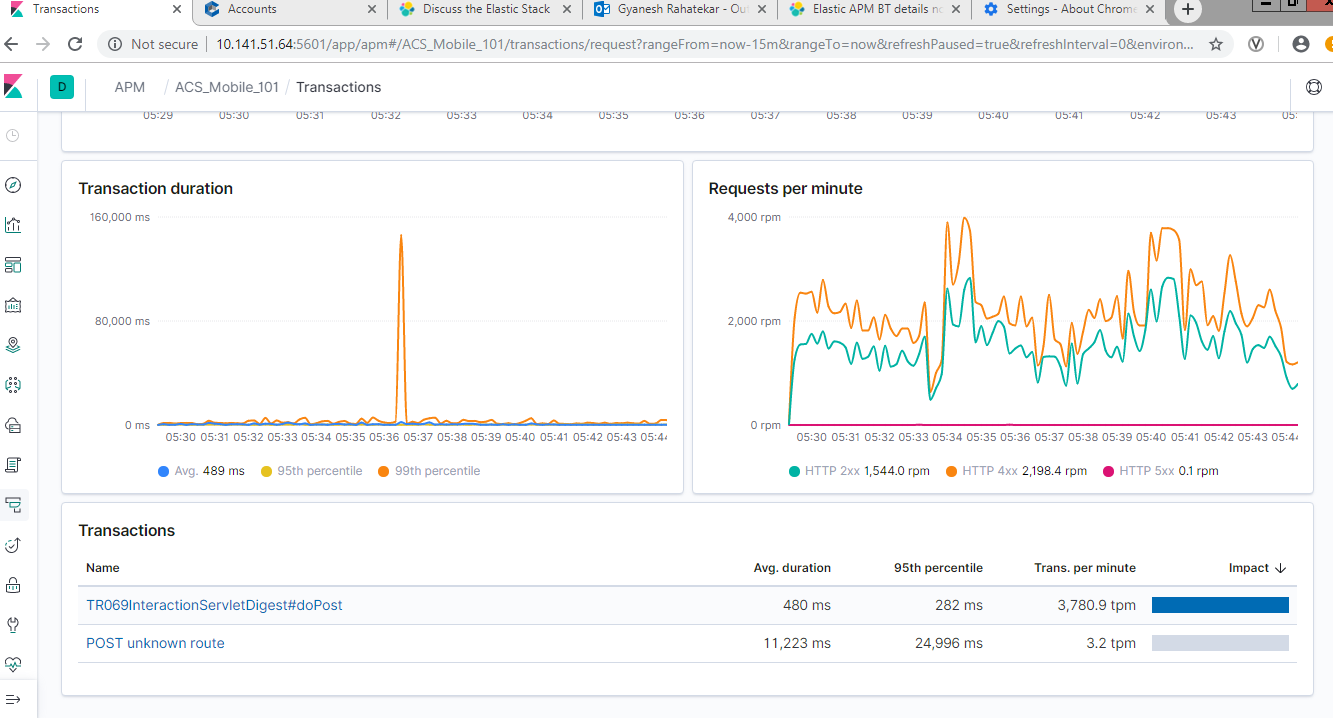
**Application running with more than 200 BT but Elastic APM capture only 2 BT related to servelet calls only it is not capture Pojo , spring bean , JMX , remote call , HTTP, Web , **:
Steps to reproduce:
Manual Instrumentation
make dir and copy agent file and instrument and pass the argument in standalone.con file
3.Restart the application
Please refrain from pasting screenshots of logs, as they cannot be searched. Instead, please copy and paste the text itself.
Please avoid non-standard acronyms like "BT". I'm guessing that you mean "backtrace", but I'm actually not sure.
As you can see in the exception message, it says
This is an expected exception. Is just use to record the reference count has been incremented.
The agent will not capture these exceptions, as they're part of the agent's normal operation. You're seeing them because you've trace level logging enabled.
What are you using? JBoss? WildFly? Other? What version?
Is this related to the TR-069 protocol? If you are installing it on a preconfigured servlet container you don't have any control of, this may explain why everything is captured through a single servlet (where you got ~3800 transactions per minute) and this may be the best you would get from it.
If you do know the internals of this application, can you say which of the supported technologies are employed by it?
The screenshot you captured is the traces view. Did you click to see if there are spans captured inside?
Not sure what you mean by failure to capture JMX, did you look in the "Metrics" tab?
Bottom line- you would get auto instrumentation and tracing for supported frameworks and technologies only.
If you have your own code running in the application, you can enhance tracing manually by using our public API.
If there are specific methods you want to trace, you can use our trace_methods config option.
Thanks for your reply on the topic. please find below the some further details :
• What are you using? JBoss? WildFly? Other? What version?
This is a JBOSS-based application
• Is this related to the TR-069 protocol? If you are installing it on a preconfigured servlet container you don't have any control of, this may explain why everything is captured through a single servlet (where you got ~3800 transactions per minute) and this may be the best you would get from it.
Yes this TR-069 protocol based application “ACS Mobile”
• If you do know the internals of this application, can you say which of the supported technologies are employed by it?
This Application based on JAVA maximum calls running with spring boot .
• The screenshot you captured is the traces view. Did you click to see if there are spans captured inside?
Yes we checked the spans but it is not much helpful.
• Not sure what you mean by failure to capture JMX, did you look in the "Metrics" tab?
Yes we checked the metrics tab but do not see any metrics in the same.
We are trying to compare the monitoring capabilities of Elastic Stack against other APM tools and have instrumented same instance with AppDynamics APM and getting more than 200 BTs which is related to ( Servelet , JMX , Spring boot , Pojo calls ) with the standard java agent configuration. but when we have checked with Elastic APM it only shows 2 BTS Traces tab.
Please set log_level to TRACE and upload somewhere the full log so we can take a look.
Since you didn't answer which of the lister supported technologies the app is using, I can't say too much, but the logs may help.
In any case, we auto-instrument the app Servlet, but there seem to be one used for many types of requests. In such cases, you can either know the application and add manual instrumentation to distinguish between types of transactions, or you can use the use_path_as_transaction_name config and get a list of transactions based on the URL path. In addition to the latter, if the application is using path parameters you may want to use the complimentary url_groups config option as well to properly adjust.
Apache, Apache Lucene, Apache Hadoop, Hadoop, HDFS and the yellow elephant
logo are trademarks of the
Apache Software Foundation
in the United States and/or other countries.

 Elastic APM BT details not capture
 or:
or: