I'm sorry, I was out of the office last week and was unable to attend this issue.
The strange thing is that the cluster doesn't seem to be under pressure. The query time is simply worse than the old version under all conditions. Maybe some tweaks related to memory vs disk usage introduced in 7.8.0 are affecting us?
Comparing your version.properties we can see the next mayor differences:
Just now I'm configuring the full cluster to use openjdk 13 instead of the bundled JDK to verify if the issue is there. I Will report here the new data.
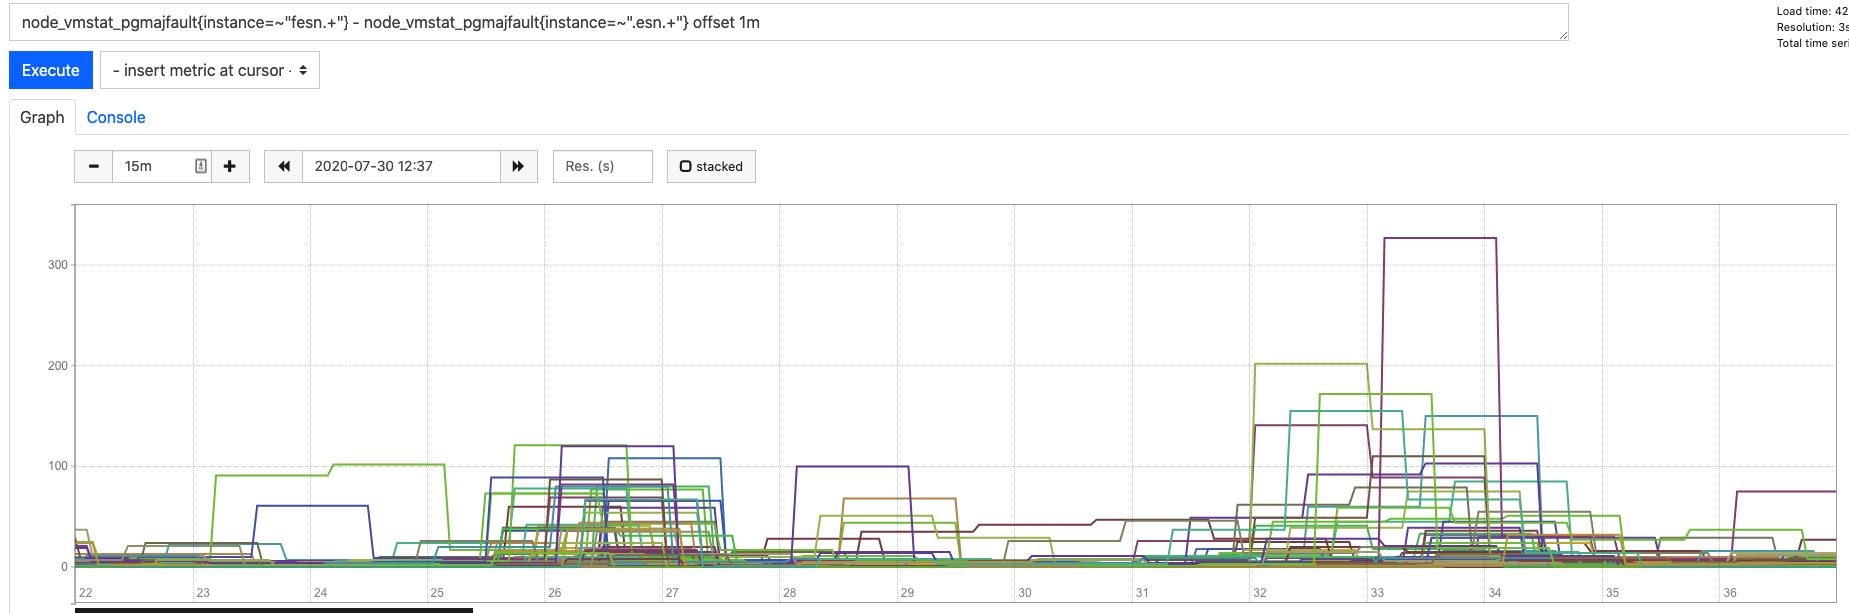
We are more aggressively using mmap to open index files instead of using non blocking i/o. That is the reason I was asking for pagefaults metrics as that might be an indication that those changes might be affecting your setup.
If you want to monitor mmapped file count, and/or compare across versions, etc. they are split out in stats (a bit confusing) as regular file handles and mmap'd files are separate; in your node stats, you can find:
In lsof these are seen together if you just do a count of open files for a process, though they can be separated. )
slabtop can also shows memory mapped count these as vm_area_struct, but system-wide and the OS uses a lot, like 10K in our case - that is the key count to compare to the system-wide vm.max_map_count though, and can easily exceed 64K, which is why the default on many systems has to be raised.
Not sure any of this helps, but FYI and if you want to see how many mapped files are in use. Suggest you get the pagefaults metrics that Ignacio wants.
Unfortunately, it didn't solve the loss of performance due to the update, so we can discard the major JDK update included in 7.8.0 as the reason for it.
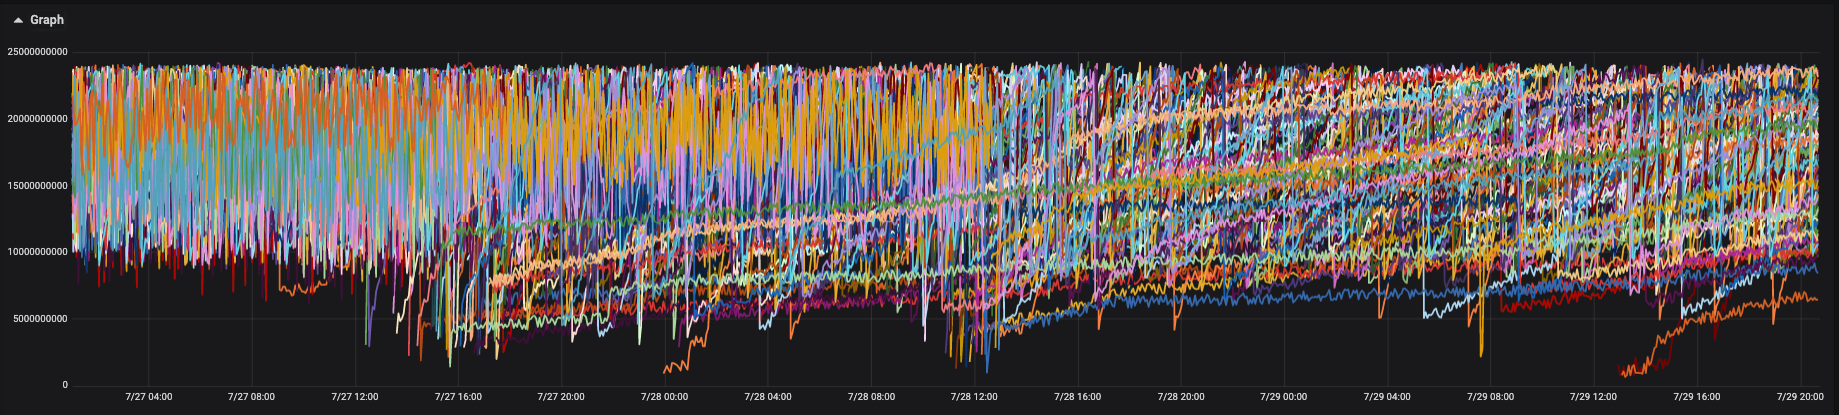
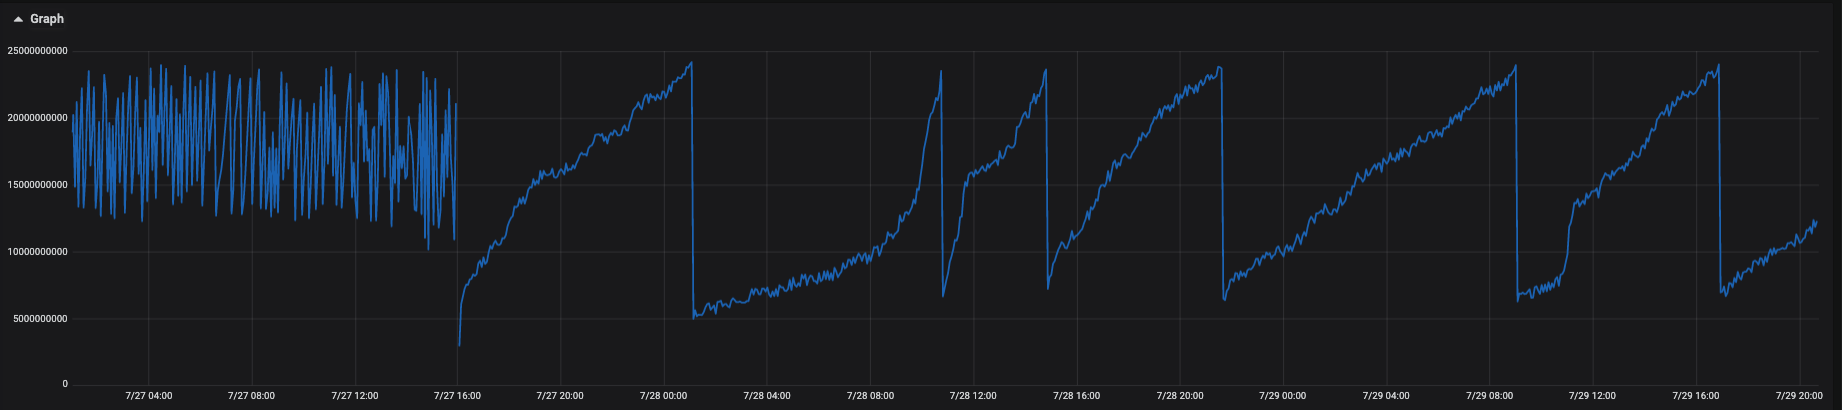
I've also enabled more monitoring in the cluster to save the pagefaults metric, here's what I see when our data analytics team is extracting data total pagefaults for every 60s:
I don't have pagefaults metrics from the 7.6.2 version.
The job from the data analytics team spends 365 min in 7.8.0 vs 231 min in 7.6.2 so it's a great loss of performance. I saw that 7.8.1 is now available. Do you think it could solve the issue? Could it be related to the change mentioned by @hoppy-kamper ?
We've been also having big performance issues on 7.8.1. Cluster was set up from scratch on Kubernetes with official Helm chart. We imported the same data we have in ES 6.8 and even with doubled resources we are not able to handle same amount of load as before.
Performance degradation is mainly manifested with heavily slowed down indexing times (rest bulk requests are taking up to 30 seconds vs standard few ms). But response time of http we are seeing from our web app is not fully reflected in increases indexing times shown in Stack Monitoring though.
Our 6.8 cluster has 3 master and 6 data nodes (16GB ram, 10GB heap, 4 CPUs, 300M documents, 36 indices, 150 shards, heavy indexing)
EDIT: We are also seeing increased CPU usage (2x-4x) with 7.8.1 like described in High OS Cpu usage on 7.7.1
@Carlos_Moya I'd think that might be the case if performance was few % lower but if cluster is literally unstable with the same data and double resources then I feel there must be some bigger underlying issue. But I guess as long as just few people are affected, there's no pointing in investigating this further on your side.
We upgraded from 7.6.2 to 7.8.1 a month ago. On day 1 , we experienced long GC times, 15-20 seconds+ , which we have not seen for a long, long time. This occurs now and then still , maybe a few times during a week. As far as we can tell , 7.8.x is doing substantially more IO than previous versions. We don't however see any decrease in ingestion throughput.
On a side note , I have learned that 7.9.x contains some fix to the G1GC , so we are currently awaiting next version of 7.9 , which we hope will help our GC issues.
Apache, Apache Lucene, Apache Hadoop, Hadoop, HDFS and the yellow elephant
logo are trademarks of the
Apache Software Foundation
in the United States and/or other countries.