We are observing inconsistent throughput metrics in the APM UI when testing locally.
 Problem:
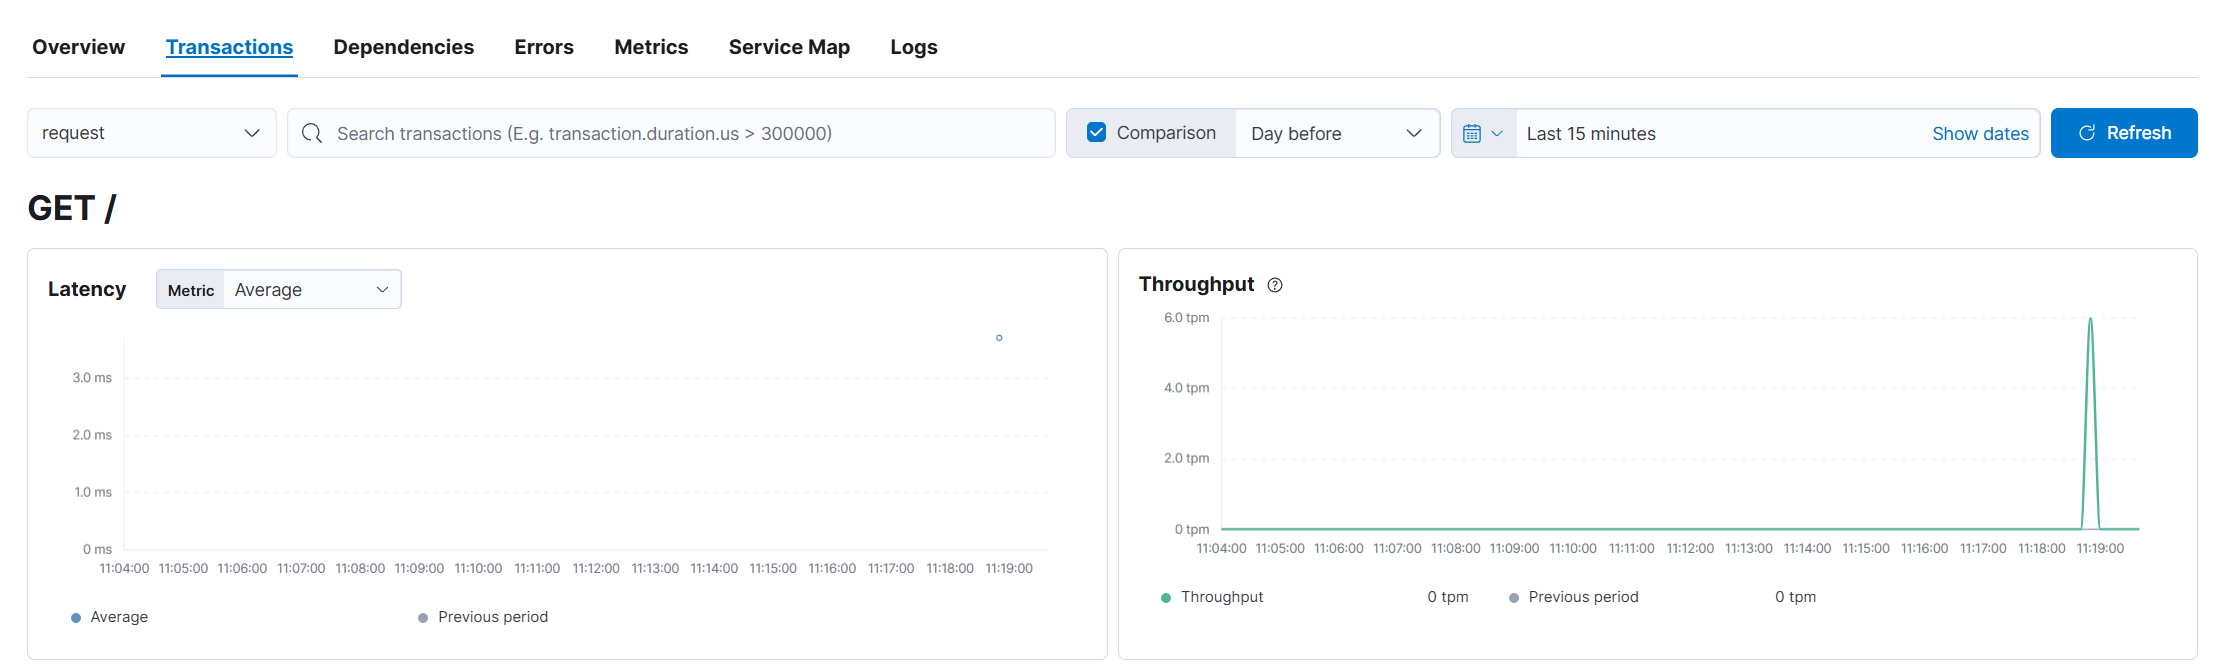
When a single GET request is sent to our .NET or Python application (instrumented with Elastic APM), the APM UI throughput chart displays approximately 6 transactions per minute, even though only one request was sent.
 Expected:
A single HTTP request from the local machine should result in 1 transaction, thus the throughput should reflect this.
 Actual:
The UI displays the throughput as ~6 tpm (transactions per minute) for each individual request.
We confirmed this multiple times using only local manual requests (via browser/Postman/curl).
We ensured that:
- There is no traffic from health checks or bots
TransactionSampleRateis explicitly set to1.0(no sampling)- No duplicate logging happens on application side
- The APM agent logs confirm only one transaction is sent
This behavior is confusing, especially during development and debugging, since it appears as if additional traffic is hitting the service.
Kibana version: 7.17.19
Elasticsearch version: 7.17.19
APM Server version: 7.17.19
APM Agent language and version: .NET and python
Original install method (e.g. download page, yum, deb, from source, etc.) and version: Deployed via Helm chart on Kubernetes.
Fresh install or upgraded from other version? Fresh install
Is there anything special in your setup? For example, are you using the Logstash or Kafka outputs? Are you using a load balancer in front of the APM Servers? Have you changed index pattern, generated custom templates, changed agent configuration etc.
- APM Server is deployed on Kubernetes using the official Elastic Helm chart.
- Output is sent directly to Elasticsearch (no Logstash or Kafka in between).
apm-server.auth.secret_tokenis enabled and agents are configured to use it.- All APM agents are configured with
TransactionSampleRate = 1.0. - No custom index templates or ingest pipelines applied.
- No load balancer between agents and APM Server.
- No data sampling is in effect.