*Recently upgraded to ELK 7.9.1.
*All beats were upgraded to match same node version
*All indexes were deleted and recreated
As stated above, I am running ELK 7.9.1. If I check Discovery section, I can confirm the data is arriving to Elasticsearch. No errors are found on each beat log, so the data it's being shipped without issues. I was able to see all kind of useful data before the upgrade, but now a lot of data it's being delivered to Elasticsearch, and yet now displayed in the Security app and Observability app.
If I go to Security app/Hosts, "authentications" and "fails" are showing data (only numbers), but in the table below, no data details is showed. No hosts it's being detected, but the data is there, because I can see it on Discovery.
Also is missing the geolocation data, which it's searchable in Discovery, but not in Security. For this I added a pipeline as described here, but without including the GeoLite2-ASN.mmdb.
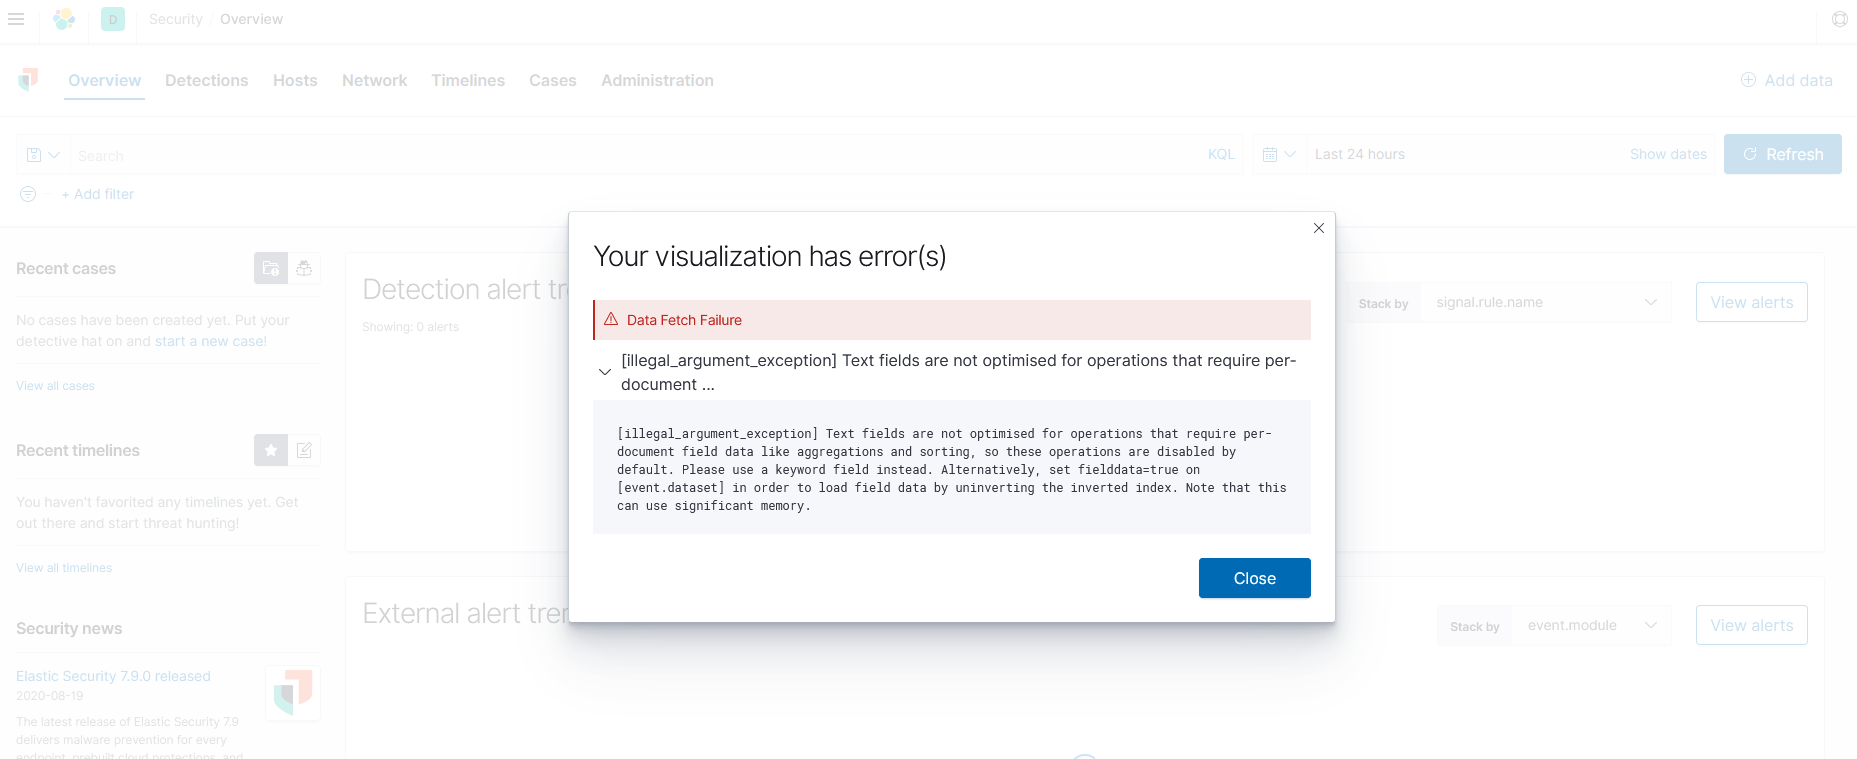
Inspecting any of the empty tables below the map in Security/Network, will show optimization errors in the Response tab. I have seen these before in my custom dashboards and I have been able to fix them by replacing field.data by field.data.keyword. But in this case I don't have access to edit the request that is running behind scenes as I can't edit any of the visualizations under Security or Observability.
{
  "took": 1014,
  "timed_out": false,
  "_shards": {
    "total": 4,
    "successful": 2,
    "skipped": 0,
    "failed": 2,
    "failures": [
      {
        "shard": 0,
        "index": "packetbeat-7.9.1",
        "node": "lzHHjlpBRC-kkvGCdMHQyQ",
        "reason": {
          "type": "illegal_argument_exception",
          "reason": "Text fields are not optimised for operations that require per-document field data like aggregations and sorting, so these operations are disabled by default. Please use a keyword field instead. Alternatively, set fielddata=true on [source.ip] in order to load field data by uninverting the inverted index. Note that this can use significant memory."
        }
      },
      {
        "shard": 0,
        "index": "winlogbeat-7.9.1",
        "node": "lzHHjlpBRC-kkvGCdMHQyQ",
        "reason": {
          "type": "illegal_argument_exception",
          "reason": "Text fields are not optimised for operations that require per-document field data like aggregations and sorting, so these operations are disabled by default. Please use a keyword field instead. Alternatively, set fielddata=true on [source.ip] in order to load field data by uninverting the inverted index. Note that this can use significant memory."
        }
      }
    ]
  },
  "hits": {
    "max_score": null,
    "hits": []
  },
  "aggregations": {
    "destination": {
      "meta": {},
      "doc_count": 0,
      "histogram": {
        "buckets": [],
        "interval": "1s"
      },
      "unique_private_ips": {
        "value": 0
      }
    },
    "source": {
      "meta": {},
      "doc_count": 0,
      "histogram": {
        "buckets": [],
        "interval": "1s"
      },
      "unique_private_ips": {
        "value": 0
      }
    }
  },
  "status": 200
}
The Security App should work out-of-the-box with the beats default configuration, so the illegal_argument_exception error's you're seeing with regard to the field datatypes potentially points towards an issue with your mappings.
You said you performed the following:
*All beats were upgraded to match same node version
*All indexes were deleted and recreated
Could you elaborate a bit more on what operations you performed/the order of events? It's interesting you're not seeing error toasts when navigating around the Security App, so I'm curious if there's some other errors we're missing. If you open your browser's developer tools and go to the network tab, do you see similar failed requests similar as to what you're seeing when inspecting the tables?
Another thing to look at is if there are other (older) index patterns on your cluster that might be matching and causing a conflict. You can try to deduce problematic index patterns by using a specific index pattern (e.g. filebeat-7.9* instead of filebeat-*) in your securitySolution:defaultIndex configuration in Kibana Advanced Settings.
As for the missing geo data, when looking at the data in Discover, do you see events with source.geo.location data? And if so, what's the format of this data, and which index pattern do you have selected?
I also considered the possibility that when changing versions, the beats map differently. On this server I have had versions 7.8, 7.9 and finally 7.9.1. This is why I removed all indexes, templates, and ILM rules linked to each beat. Then I used the setup command, to force each beat to recreate its indexes, templates and ILM rules. I was looking for a fresh start.
Basically I did the following:
Stopped the beats
Removed indexes in Elasticsearch from Index Management
Removed Legacy index templates from Index Management
Removed ILM Rules from Index Lifecycle Policies
Removed Index Templates from Index Patterns
Uninstalled all beats
Installed all beats without starting the service
Started just one beat in one server (I think I started with Auditbeat)
Ran setup command
Started service
Checked beat logs (no connection nor data shipping errors)
Confirmed creation of index and index patterns in Elasticsearch
Checked Discovery and confirmed all data was arriving
I am using Firefox and when inspecting any of the tables below the map in Security/Network or Security/Hosts, I only see a bunch of "GET" requesting many files to load the page (mostly .js), but I don't see any errors (or maybe I'm not searching correctly).
As for the indexes patterns, I removed all old indexes and patterns (unless I have missed a system index). I'd like to avoid (if possible) making specific modifications like telling Security to use other indexes than the generic ones that come by default. I love that ELK works well with most of the default settings. Otherwise I would have to be remembering to update securitySolution: defaultIndex every time I update ELK or the beats.
I think that a cleaner and more durable solution would be to be able to delete the system indexes that Security uses (if any, like .siem-signals-default) to store the data that it then shows. I don't know if what I just said makes much sense.
As for the geolocation, I have a lot of events in Discovery (from today) including the following fields:
If you need more details or if I did not provide all the information you requested, please let me know. I also ask for your patience and understanding if at times I don't quite understand what you are asking.
I am experiencing a similar issue with Observer and reported here. It may (or not) be related to the Security issue. But I've include the link, just in case you want to take a look and perhaps could find useful information.
I have seen these before in my custom dashboards and I have been able to fix them by replacing field.data by field.data.keyword
I would be very careful about changes like that and here's why. What might be happening is that you are ingesting data very quickly right as you are deleting your mappings and then Elastic Search is auto creating your indexes by "guessing" at them before you had a chance to run the beats setup:
What you dont want really is ES taking a guess at the indexes before you had a chance to run "setup" from the beats. When that happens because your data ingest is not turned off when you're deleting beat mappings ES is going to make naive and ambiguous choices that will not work out well for most cases. Good examples will be that you would start to notice things like source.ip is now a keyword and text data type rather than an ip data type which is then not going to work with CIDR patterns from detection rules.
I put some links to other times we have helped people out, but I would ensure that your mappings match that of beats and reindex if they do not. If you do delete them, I would ensure you turn off existing beats first so you don't get auto-created indexes or you can set ES to tell it to not auto-create index mappings for a brief moment of time and get dropped messages for a few seconds while you upgrade to your next set of mappings.
fwiw, you can do a manual export of a beats mapping as well to compare them to your current mappings that might or might not be auto-created:
Thank you for joining to the discussion. When I said that I was replacing field.data by field.data.keyword, I was talking about the fields included in my own visualizations. I was updating just the fields within the visualization. I am not sure if this would affect all Elasticsearch, but I am not an expert. When I completed the last upgrade, a lot of visualizations were not showing data, and I was getting pop-up errors from Kibana stating those fields were not optimized for per-document... actions? (I can't remember the exact message). Then it suggested to make that change Ex: "winlog.event_data.TargetDomainName" to "winlog.event_data.TargetDomainName.keyword". By doing this the table started showing data again and the error was gone. I was fixing these errors one by one, until all pop-up errors were gone.
I just tried what you said:
-Stopped the only beat running
-Removed index and index template in ES. The index template was under Legacy Index Template
Confirmed nothing containing the beat name can be found in ES
-Manually exported the beat template from server
-Manually imported the beat template into ES. Got the confirmation that all went OK {"acknowledged":true}
-Confirmed the new index template is now available in ES/Legacy Index Template
-Started the beat to ship data to ES. No errors in beat logs
-Confirmed data is arriving to ES, but details are not showing up in the Security tables.
I can see data under Security/Host/Events/Events (including the host names, but the table Hosts is empty. When inspect the details) I see the same error:
{
  "took": 0,
  "timed_out": false,
  "_shards": {
    "total": 2,
    "successful": 1,
    "skipped": 0,
    "failed": 1,
    "failures": [
      {
        "shard": 0,
        "index": "auditbeat-7.9.1",
        "node": "lzHHjlpBRC-kkvGCdMHQyQ",
        "reason": {
          "type": "illegal_argument_exception",
          "reason": "Text fields are not optimised for operations that require per-document field data like aggregations and sorting, so these operations are disabled by default. Please use a keyword field instead. Alternatively, set fielddata=true on [host.name] in order to load field data by uninverting the inverted index. Note that this can use significant memory."
        }
      }
    ]
  },
  "hits": {
    "max_score": null,
    "hits": []
  },
  "aggregations": {
    "hosts": {
      "value": 0
    },
    "hosts_histogram": {
      "buckets": [],
      "interval": "1s"
    }
  },
  "status": 200
}
Is there any other index, template or system index, that I should delete to have a fresh app start? If not, what else I could try?
It looks like my host.name field is not being mapped correctly, as I see it as a text field. But where is coming from this mapping? I manually uploaded the template to ES, when the beat was not sending data. Even when I have done this via setup in other times, the service is not running yet, and therefore there is not data being shipped. Am I missing any other index?
This is tricky. If everything is shut down then you shouldn't be missing anything else. If you delete that index and it begins just re-appearing then somewhere something is still pushing in data and recreating the index automatically with a new defaulted mapping.
Turning off auto_create_index for a small amount of time might be helpful for you
Docs here:
Fwiw when you run setup from beats it is going to create "templates" and "ILM" (index life cycle management) if it can to make index management easier.
You can see those here in your dev tools:
GET _ilm/policy
GET _template
Those templates and policies are helpful as they are what makes it so that beat indexes take the correct index when being created as well as control when to roll old data to other indexes and retention policies.
Thank you for your support. Here we go:
1- Stopped all beats
2- Removed all indexes and index templates
3- Confirmed all beats indexes are gone
4- Stopped auto_create_index
5- Ran setup from a beat that is NOT shipping data to ES
6- Confirmed an index template was added to ES
7- Confirmed an ILM policy was added to ES
8- Started beat service
9- Error log stating failed to index into ES. Probably due to auto_create_index being disabled
10- Stopped beat
11- Re-enabled auto_create_index
12- Started beat service. No error logs
13- Confirmed index being created
The bad news is that the issue persist. My head is going to explode from thinking so much. I've tried so many times to do everything from scratch and this still happens. I don't know what I may be missing.
This morning I decided to install ELK 7.9.1 and all beats from scratch. This is a clean installation. I just setup Auditbeat and Heartbeat to test Uptime and Security. Uptime is displaying the error "Internal Server Error" and Security is displaying the error "Data Fetch Failure", and when click on "See the full error(s)" you can see the know error that we were talking about from the start.
Not sure where the root issue is, but after importing the index template (either with setup or manually with curl) I can see the mappings seems to be right, but then data is being indexed apparently with errors, causing Uptime and Security can't work properly.
This issue started after I upgraded to ELK 7.9.1 and upgraded the beats to match same version. Could this be a bug on this version?
If you have more ideas or steps for troubleshooting, please help me.
Then I went to my DEV env in Kibana and saw that it has mappings and that the SIEM application looks ok with 7.9.1 so far with regards to mapping of that field and the data output.
Mine does not looks like yours.... What am I doing wrong?
I also don't think the problem is the ELK version. This morning I installed version 7.7.0 and did not configure anything else except Heartbeat and Auditbeat. As soon as Heartbeat started sending data, Observer started displaying the error related to the wrong field.
It is already clear that the problem is in a wrong mapping, but what can be causing it and how to fix it?
The data of the beats goes directly to ES, it does not go through Logstash. Where can the error be generated when indexing the data, if the templates are apparently correct?
All I do when I install the beat is to replace the config file (* .yml) with one that already has the server configurations, but I don't think the configuration file is the cause, since it only specifies the connection parameters to Kibana and ES, and the beat logs.
Could it be something related to ILM? This is the only thing new that I started seen when I moved to ELK v7 and that I included in the beat config.
My hope was to run a previous ELK version not having the issue, but now I'm stuck.
I'd just walk it backwards a bit from the dev tools. Your index is created from a mapping that lives in your _template like so below. Whenever it sees a new index created that matches the pattern I have highlighted it auto-adds that mapping. Maybe yours is something different or something wrong after you ran setup that is causing some type of interference?
Against what should I compare? Templates have many fields. How do you know which ones are right and which ones are incorrect? When I find wrong fields, do I just manually overwrite them one by one?
I would start by seeing if you have a template or not with an index_pattern like the screen shot above which would be heartbeat-7.9.1-*. When ES auto creates an index it looks in the _template to see if it matches the `index_patterns" of a template and if so it chooses to use it.
If it does not have it, then it auto-creates the index and uses default guessed values or a default "catch all" you could have in your _template.
In a normal operational beats setup like the one I setup this morning beats will auto-create templates for you such as mine did for heatbeat-7-9-1-* with the mapping listed in it.
Working backwards we are seeing if you have these templates or not and what they look like. There's a lot of things in your environment that could be potentially preventing your new indexes from being created with the expected mappings, so these are more just trouble shooting steps and guesses for you if they help you out.
You should also cross reference the abilities of the different beats and their setups including the manual ones as you can potentially use that information to manually fix your templates and then re-create your indexes as a way to fix what you have.
More info on templates:
More info on filebeat's manual templating (each beat could be slightly different but this should give you an idea of at least one and different ways of loading its template and mappings for trouble shooting). Refer to your particular beat's documentation:
I think I may have found the root cause. I installed ELK from scratch (one more time). Since we concluded the version is not the issue, I reinstalled ELK 7.9.1 + Auditbeat and Heartbeat 7.9.1.
What I did different this time was NOT include the following lines in the beats config files:
Oh my gosh! What a time! This really makes my evening. Really glad you stuck with troubleshooting and got to the root cause and a fix. cheers and best of luck with observability and security.
Apache, Apache Lucene, Apache Hadoop, Hadoop, HDFS and the yellow elephant
logo are trademarks of the
Apache Software Foundation
in the United States and/or other countries.


 cheers and best of