End to end latency with traces

Elastic APM transactions tab shows a nice graph about the latency distribution as shown below


w:

However, this latency distribution is only for taht specific app. How to visualize latency distribution for traces which passes through multiple applications?

Simplifying the question: How to find traces(not transactions) which took a lot of time (say more than 5 seconds)?

Is there any way to find such traces in Elastic APM UI?

Hi @sangramreddy

The screen you are looking at is actually End-to-End Tracing it happens to be only going through 2 services... you are at the top Service... so that is end to end. You just need to instrument / add the agent to all your service a

I am not sure exactly which demo you are using ... but I have a betting one for you to look at.

You can visit our full demo at

https://demo.elastic.co

Here is a full service map

Then if you want you can looks at the traces here

And sort by long running traces...

And if you click on that top traces /product/66VCHSJNUP or whichever one comes up

You will get the full end-to-end trace with timing...

That goes through multiple services and show the full end-to-end timing

Also important if you start from a service in the middle of the trace example the product catalog service because that is where you entered Elastic APM you click on the View Full Trace to see the full trace

In your simple example you are already at the top of that trace... if you clicked on the opbeans-pythion the Vuew Full Taces button would show

hope this helps!!

What you have highlighted isn't actually long running traces. Its the avg. latency of that specific originating service.

That's where my problem is, how to find long running traces? There doesn't seem to be a way.

Say I have a stack of 5 applications, and a trace passes through all of them. How to find out requests that spent most of the time in the stack, not just a single applciation.

Hi @sangramreddy

Yes but from the front-end service, the latency of that service represents the total of all the latencies of the downstream services...

The 1321ms of the example trace is the total time of the traces through the Originating + 4 down-stream services ...the total time of the trace

Apologies... I am not sure then what you are asking ...

If you have 5 services .. .

1 calls 2 calls the Calls 4 etc..

If you look at the total time for service 1 ... it will be the total of all the time it took for the entire trace...

Yes the traces in the list overview is the Average but you can find the long running traces easily.

And there is also a latency distribution graph that show the distribution of latency and long running Traces / Transaction that are traced all the way through the system

Example

Start here

And Click on Cart For Example

The Scroll Down and Now we see the Latency Distribution
That is the latency through the whole system
Highly the long running transitions

That is the latency through the whole system AND when you scroll down you can see which services are contributing to the Overall Long Trace.. This is a very common approach

The 8,342ms is the time for the trace through the entire system... And yes it is Also the times for the Orginating service, that is how tracing works.

AND you can enable anomaly detection on all the service which will detect abnormal latency

If that is not correct / not what you are looking for you will need to provide more insight

Ohh and of course I forget we try to lead you to where the biggest impact is

Sort by Impact

ok. But this is not what is being shown to us in our apps.

We have a bunch of Java microservices which are connected via Kafka. Kafka streams are being used which is not officially supported by Elastic Java agent automatic instrumentation.

For this reason, we are using APM Java public API to create transactions and then pass the trace ID via Kafka headers.

But it appears that the link is being broken somwhere. The traces are properly being linked and total time taken is shown when we are looking at the Trace timeline. However, the graphs shown are not taking the total time of the trace, but only the time of that originating service only.

You can see from the above imagethat max latency ditribution graph sclae shows is 10ms. But the trace itself took about 26ms.

In our case, the latency distribution graph is only considering App 1. But the traces are all linked upto App 5.

Hi @sangramreddy

Ok well... that is a completely new context / information you really should start with those important details ... :slight_smile:

And apologies I can not really tell from the screenshots what is going on...

So I think what you are saying is that you have Java Microservices that are Messaging through Kafka Streams (which is not automatically supported) and so you are trying to manually create Transactions / Traces / Trace Parent etc via the Public API.. ... and it does not seem to be working... OK so that is a whole lot / different topic :slight_smile:

What I would suggest is that you open a New Topics with a Subject like:

Java Service with Kafka Streams: Issues with Injecting / Propagating Tracing Information with Public API

Then show as complete samples of code (NOT screenshots) as you can with Using the Public on both the Calling Service and Receiving Service (you will probably need to implement the and describe your architecture as best as you can and perhaps one of the APM Java Folks can help you.

You are going to need to implement the custom header injection and Extractor Interfaces from the headers via functional programming...

You will also probably need to debug a bit...

that will all need to work before you get the correct results / distributed tracing etc.

AND since you have a message queue in the middle I am not clear exactly how all the timing will be calculated...

So you have some work to do... you need to get the tracing to work first!

BTW here is a really old example I wrote... it probably will not work... but should give you an idea... You will add to add and get the Trace / Transaction to and from the headers... mine was a custom object.

The syntax / extractor has changed ... but the principal is the same

You will need to use the new Syntax

Interface Description
HeaderExtractor Used to extract the first header with a specific header name.
HeaderInjector Used to inject a header into a networking library's underlying outgoing request object.
1 Like

Thank you!

I did post on this topic earlier but did not get much help.

I had to add encode/decode methods according to the format expected from agent. This does not seem correct and could easily break. I thought there must be a better way, but didn't get any info on that from your documentation or forum.

Will take a look at the code.

I would have kept in that thread plus you didn't actually share any of your code....

Also if you look at my code which is wrong because it's out of date with respect to the new syntax..
But the idea is the same and I would do printouts / logs or something so you can see the tracing...

You should be Able to print out or debug the trace parent headers etc.

You need to see that they're actually flowing through...

If I get a chance to update mine I will but I wouldn't expect it. I'll get around to that anytime soon

You could of course clone my repo and update it with the new syntax... I'd be happy to look at it

I'm not sure exactly what you mean by brittle. There are other people using this successfully for sure.... The only point is you need to implement a solid solution.

Did you take a look at OTEL?

The code is mostly similar. I was not using "injectHeaders" API call earlier, but was manually adding the trace to headers. Aprt from that the code looks similar.

And my trace timeline exactly looks like what you have shown in that github page:

https://raw.githubusercontent.com/bvader/pipelineapmexample/master/imgs/actual_result_new_7_2.png

Now, notice the difference between these two:

Example where its working (from demo app):

Example where its not wokring (from your github page/my app):

Demo app has: frontend-rum->frontend-node->cartService...
originating app is "frontend-rum"

You example app has : Source->process1->process2->Sink
originating app is "source"

And unlike "frontend-rum" in demo app, "Source" app doesn't extend its span until the end.

Is it because the demo app is synchronous and waits for its spans to complete, and kafka example app is asynchronous?

Yes Exactly! (Waits for the transaction to complete but yes)

The demo is synchronous REST Calls so the Parent transaction waits for everything to complete

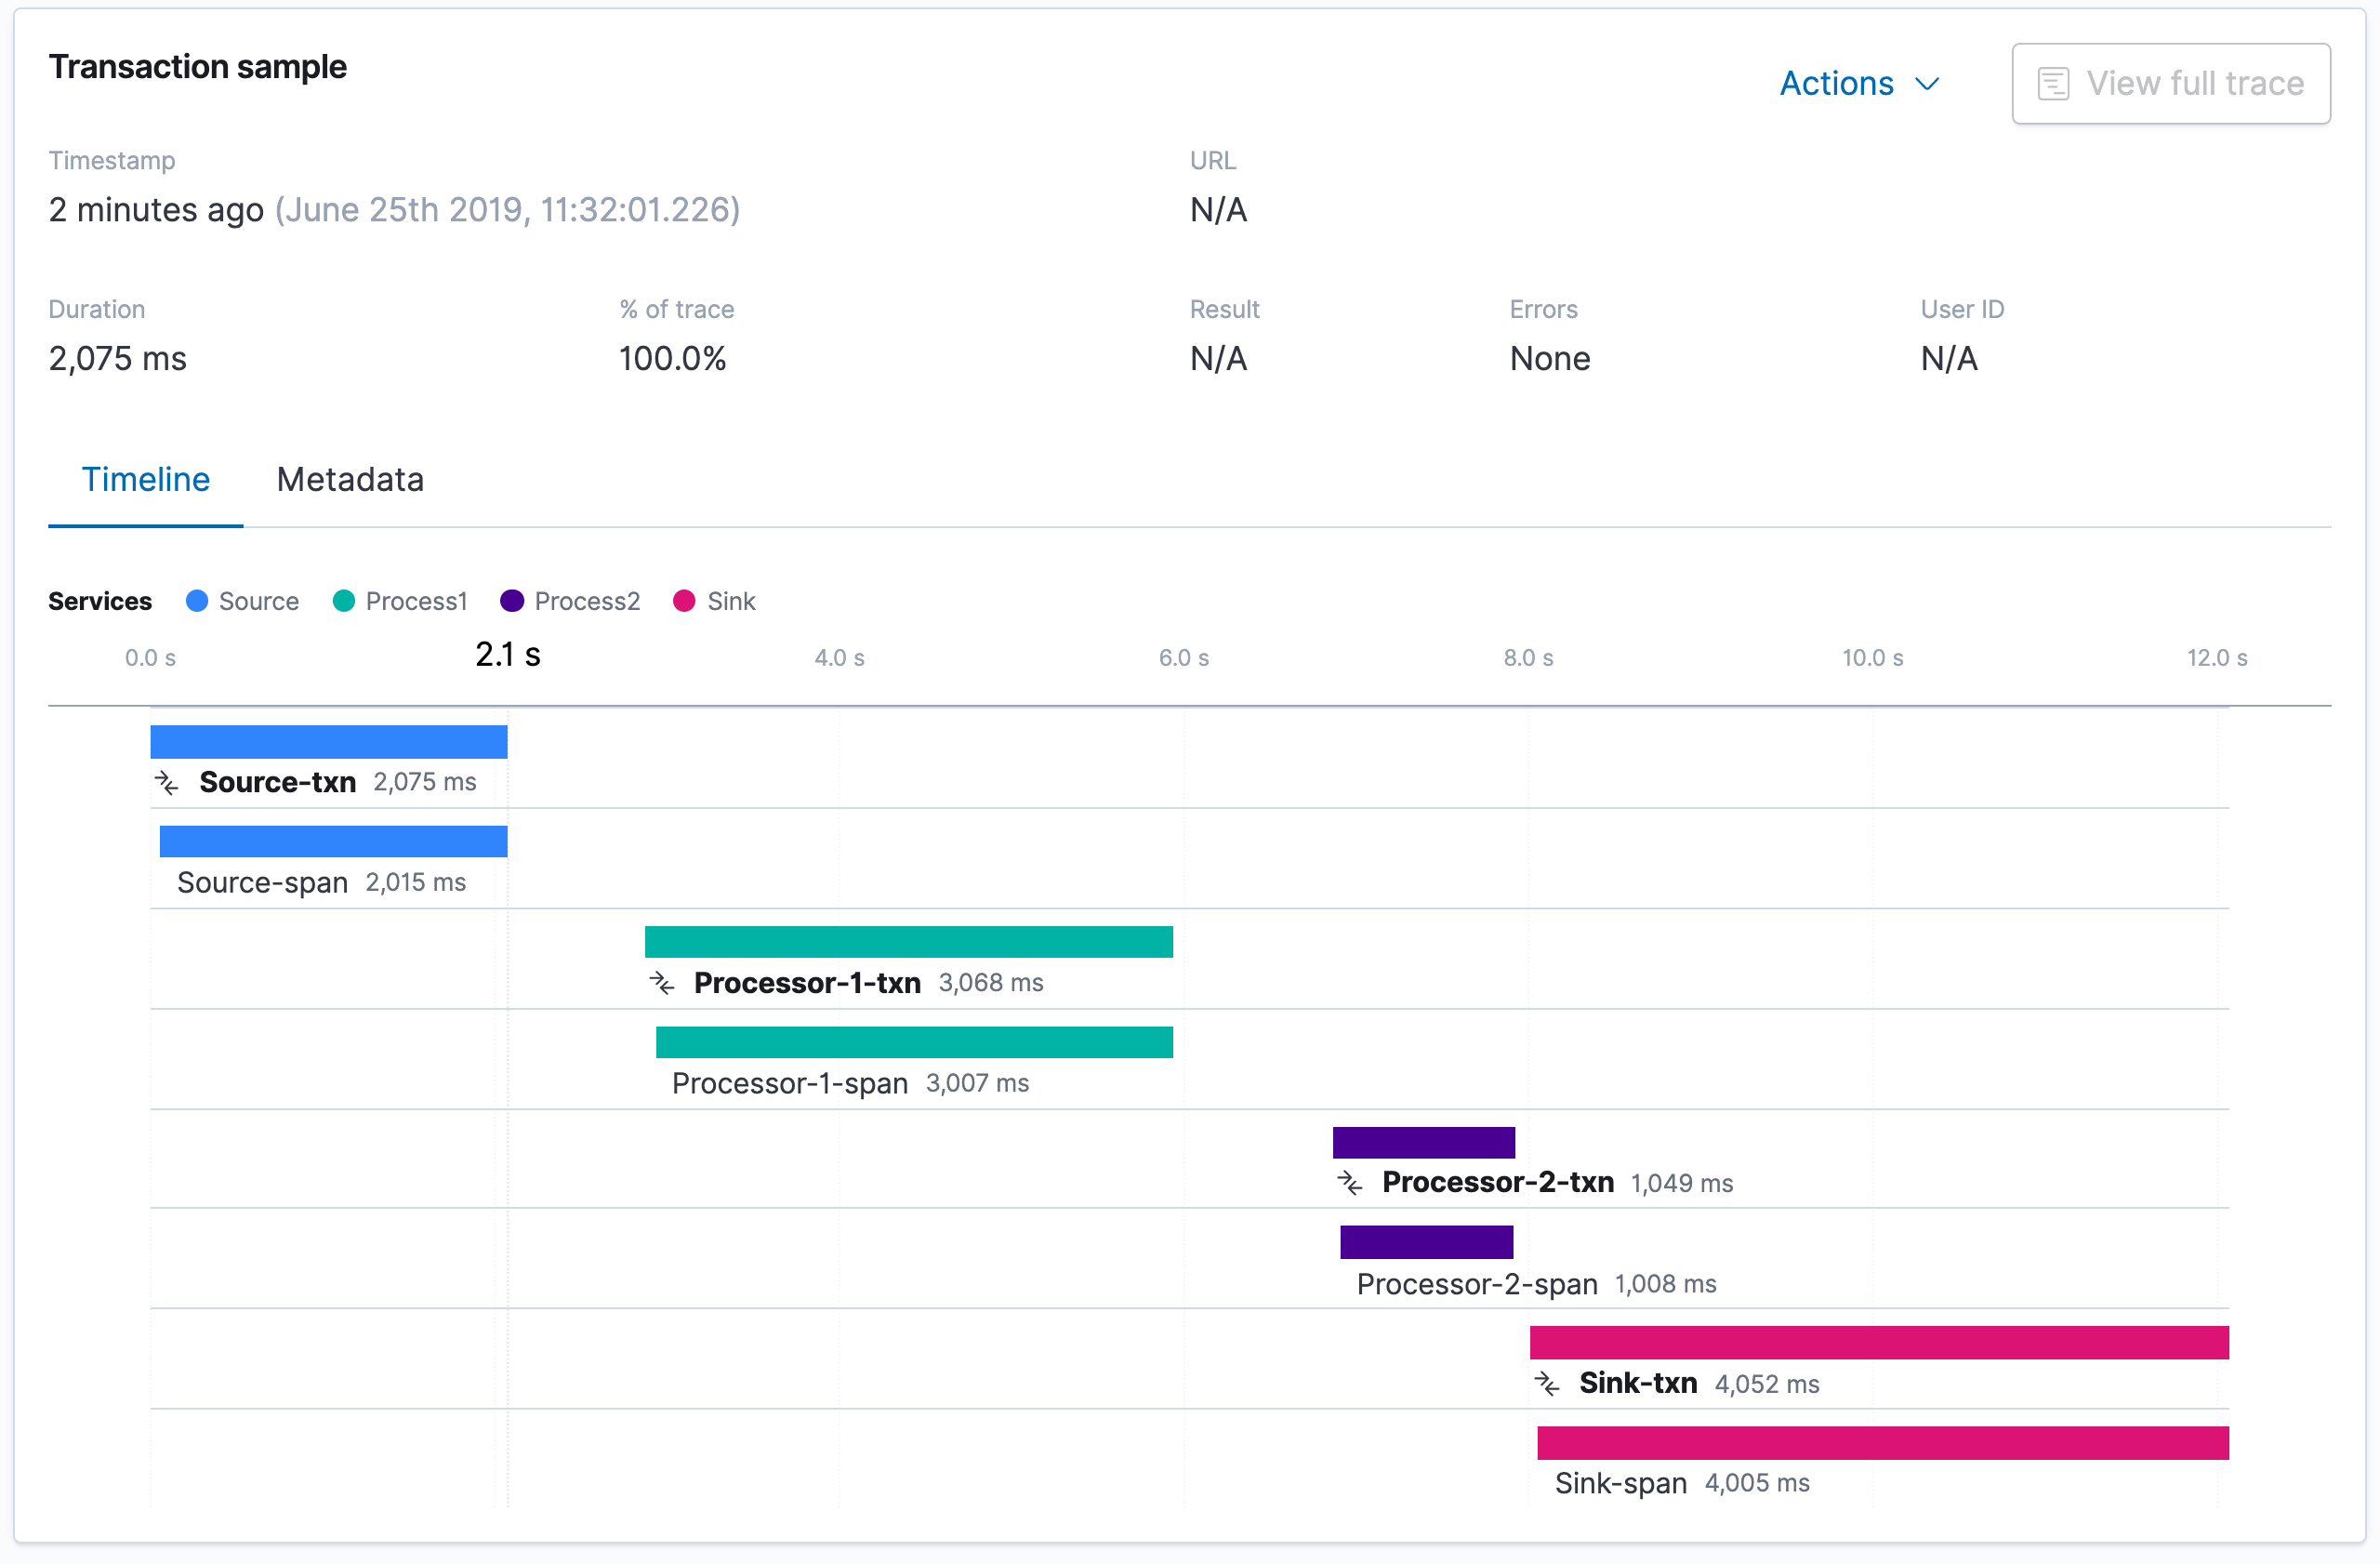
The process example is asynch.... Each process transactions complete but you still get the estimate of the overall trace time

Your process is asynch I believe ....

Calculating the total end-to-end trace time for a multi-service message-based asynchronous system where messages could sit in queues and it is never really clear when the trace ends...is not easy.... perhaps not really accurate/feasible.

One reason I believe is that you never really know when the last service is run... maybe it is sitting in a queue somewhere... the Waterfall shows that elaspsed time.. I just don't think the actual value is calculated... because there is no "finite finish" to it if 5 mins later another service ran with the same trace.id the waterfall would be updated.

This is different than a synchronous "waterfall" where there is a definite end.

BTW I just ran my processor and it still works with the latest java agent (not sure why I would have thought it would complain about my Header Handlers but in short I am passing in the correct values. This allowed me to test some things

$ TAG=1.39.0 ./run-pipeline.sh

a) But you can pretty easily sum the transactions times (what you would be missing is the queue delay)

b) You can also look pretty easily calculate the difference in time from the start of the first transaction to the start of the end transaction

c) Of course the real total elapsed time would be for a given trace.id NOT easy

Last Service Time stamp (max @timestamp ) - Originating service (max @timestamp) + Duration of the last service transaction.duration.us

I did create this table in Lens it is not exact ... it shows the sum of the transactions and the max timestamp (beginning of last transaction) - min timestamp (start of 1st transaction)

perhaps that will get you started

So this is my processor example which still seems to work

Is there a way to specify Service(max(@timestamp)) ?

I filtered both originating service and last service, then used top 10 trace.id, and in metric used max(@timestamp) - min(@timestamp)

It does seem to return correct values although not clear which timestamp it is looking at

Not that I found... I would need to look closers... perhaps but you would need to know which service is "Last" I think which may not make sense

It is aggregating by trace.id so the min / max is per trace.id so if there are 10 services in a trace it will find the min / max across the 10 services.

Cool. Thanks very much for the help!

Will dig more on the query language

1 Like

Use Lens and Formulas too... then you can see the underlying Queries

Great conversation / discussion @sangramreddy Let us know where you end up!

This topic was automatically closed 28 days after the last reply. New replies are no longer allowed.