My Endpoint Health Status changed to unhealthy on my Windows Endpoint a few minutes after it had shown healthy. I have disabled my Windows firewall and checked my policy configuration. What could be the problem?
Can you view the Agent’s details in Fleet? (Fleet → Agents → Click on the Agent’s hostname in the table). That page will show which integration is unhealthy. Given what you said, presumably it’s the Elastic Defend integration but there’s a chance it’s a different integration. Regardless, you should be able to expand details for the failing integration to see what’s wrong. If you aren’t able to resolve the issue after seeing those results please just share what them and I can help.
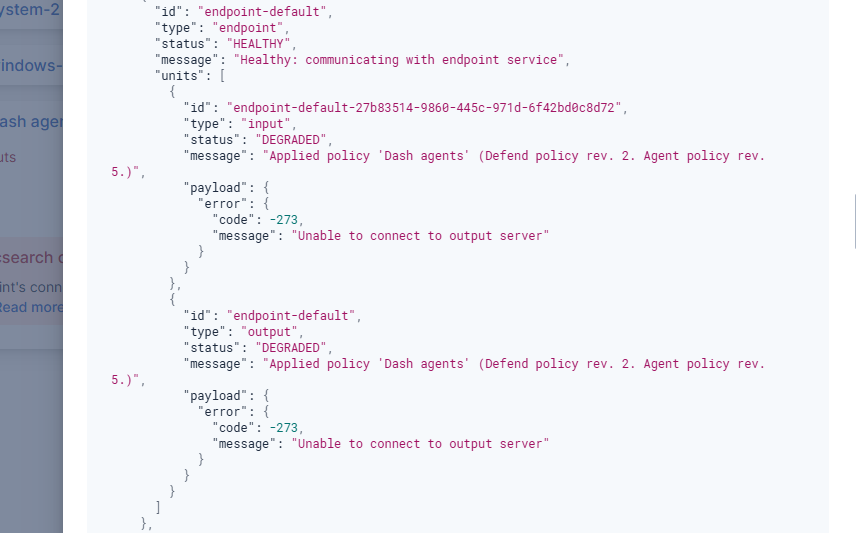
Thanks, that’s helpful context. That error means the Endpoint (the executable that runs on hosts with the Elastic Defend integration) cannot connect to the output server (Elasticsearch, Logstash, or Kafka).
Agent information appears in Kibana because its control data channel is with Fleet Server, but Endpoint and other integration data is written directly to Elasticsearch/Logstash/Kafka. So there’s a chance the issue is Elasticsearch/Logstash/Kafka are not reachable from the host. There’s also the chance this is an issue specifically with Endpoint even though Agent and other integrations can reach Elasticsearch/Logstash/Kafka. Debugging this from an Endpoint perspective is the easiest approach, I’m just mentioning this so you understand the problem could be a generic networking or SSL problem even though the Agent appears in Kibana.
Looking at Endpoint logs is the best next step. Depending on your Agent configuration and the exact problem those logs might already be ingested into Elasticsearch. But an easy way to access them whether or not they’re already in Elasticsearch is to grab an Agent diagnostic zip. To do that go to Fleet → Agents → Click on the failing Agent hostname → Diagnostics tab.
In the zip that’s returned look at the Endpoint log with the highest number in the filename format logs/services/endpoint-XXXXXX.log. You should see something in there that indicates what the problem is. Endpoint will try to connect to Elasticsearch periodically so it should be a periodically repeating message.
I hope that helps. Of course let me know if you’re still stuck.
If you can reach the host to execute directly any command or can use execute response action, I’d recommend to execute test output command