Error using logstash : ParserError: Unexpected character ('<'

Hello,

I have been using ELK for a while and I am trying to retrieve the logs from a Wifi controller (Aruba Mobility Master). I checked with Wireshark, and I'm getting my syslog packets fine. However, logstash makes an error for each received packet:

C:\data\logstash>bin\logstash -f config\logstash-test-aruba.conf
"Using bundled JDK: ""
OpenJDK 64-Bit Server VM warning: Option UseConcMarkSweepGC was deprecated in version 9.0 and will likely be removed in a future release.
C:/data/logstash/vendor/bundle/jruby/2.5.0/gems/bundler-1.17.3/lib/bundler/rubygems_integration.rb:200: warning: constant Gem::ConfigMap is deprecated
Sending Logstash logs to C:/data/logstash/logs which is now configured via log4j2.properties
[2021-08-13T10:59:24,178][INFO ][logstash.runner          ] Log4j configuration path used is: C:\data\logstash\config\log4j2.properties
[2021-08-13T10:59:24,188][INFO ][logstash.runner          ] Starting Logstash {"logstash.version"=>"7.14.0", "jruby.version"=>"jruby 9.2.19.0 (2.5.8) 2021-06-15 55810c552b OpenJDK 64-Bit Server VM 11.0.11+9 on 11.0.11+9 +indy +jit [mswin32-x86_64]"}
[2021-08-13T10:59:24,278][WARN ][logstash.config.source.multilocal] Ignoring the 'pipelines.yml' file because modules or command line options are specified
[2021-08-13T10:59:25,785][INFO ][logstash.agent           ] Successfully started Logstash API endpoint {:port=>9600}
[2021-08-13T10:59:26,301][INFO ][org.reflections.Reflections] Reflections took 53 ms to scan 1 urls, producing 120 keys and 417 values
[2021-08-13T10:59:27,121][INFO ][logstash.outputs.elasticsearch][main] New Elasticsearch output {:class=>"LogStash::Outputs::ElasticSearch", :hosts=>["//127.0.0.1:9200"]}
[2021-08-13T10:59:27,402][INFO ][logstash.outputs.elasticsearch][main] Elasticsearch pool URLs updated {:changes=>{:removed=>[], :added=>[http://127.0.0.1:9200/]}}
[2021-08-13T10:59:27,534][WARN ][logstash.outputs.elasticsearch][main] Restored connection to ES instance {:url=>"http://127.0.0.1:9200/"}
[2021-08-13T10:59:27,572][INFO ][logstash.outputs.elasticsearch][main] Elasticsearch version determined (7.14.0) {:es_version=>7}
[2021-08-13T10:59:27,572][WARN ][logstash.outputs.elasticsearch][main] Detected a 6.x and above cluster: the `type` event field won't be used to determine the document _type {:es_version=>7}
[2021-08-13T10:59:27,619][WARN ][logstash.outputs.elasticsearch][main] Configuration is data stream compliant but due backwards compatibility Logstash 7.x will not assume writing to a data-stream, default behavior will change on Logstash 8.0 (set `data_stream => true/false` to disable this warning)
[2021-08-13T10:59:27,634][WARN ][logstash.outputs.elasticsearch][main] Configuration is data stream compliant but due backwards compatibility Logstash 7.x will not assume writing to a data-stream, default behavior will change on Logstash 8.0 (set `data_stream => true/false` to disable this warning)
[2021-08-13T10:59:27,688][INFO ][logstash.outputs.elasticsearch][main] Using a default mapping template {:es_version=>7, :ecs_compatibility=>:disabled}
[2021-08-13T10:59:27,719][INFO ][logstash.javapipeline    ][main] Starting pipeline {:pipeline_id=>"main", "pipeline.workers"=>4, "pipeline.batch.size"=>125, "pipeline.batch.delay"=>50, "pipeline.max_inflight"=>500, "pipeline.sources"=>["C:/data/logstash/config/logstash-test-aruba.conf"], :thread=>"#<Thread:0x15ffbb2f run>"}
[2021-08-13T10:59:28,405][INFO ][logstash.javapipeline    ][main] Pipeline Java execution initialization time {"seconds"=>0.69}
[2021-08-13T10:59:28,437][INFO ][logstash.javapipeline    ][main] Pipeline started {"pipeline.id"=>"main"}
[2021-08-13T10:59:28,474][INFO ][logstash.inputs.udp      ][main][171962edfa0cfd61c4a7d15d6f352f1f97843ffcb9f46c020c0a4481b88672af] Starting UDP listener {:address=>"0.0.0.0:514"}
[2021-08-13T10:59:28,506][INFO ][logstash.agent           ] Pipelines running {:count=>1, :running_pipelines=>[:main], :non_running_pipelines=>[]}
[2021-08-13T10:59:28,521][INFO ][logstash.inputs.udp      ][main][171962edfa0cfd61c4a7d15d6f352f1f97843ffcb9f46c020c0a4481b88672af] UDP listener started {:address=>"0.0.0.0:514", :receive_buffer_bytes=>"65536", :queue_size=>"2000"}
[2021-08-13T10:59:37,183][ERROR][logstash.codecs.json     ][main][171962edfa0cfd61c4a7d15d6f352f1f97843ffcb9f46c020c0a4481b88672af] JSON parse error, original data now in message field {:error=>#<LogStash::Json::ParserError: Unexpected character ('<' (code 60)): expected a valid value (number, String, array, object, 'true', 'false' or 'null')
 at [Source: (String)"<139>Aug 13 10:59:37 2021 MC72-WI-AS1-06-A <MC72-WI-AS1-06-A 172.20.10.10> httpd[21903]: Could not retrieve the CSRF token from db inside mod_aruba_auth"; line: 1, column: 2]>, :data=>"<139>Aug 13 10:59:37 2021 MC72-WI-AS1-06-A <MC72-WI-AS1-06-A 172.20.10.10> httpd[21903]: Could not retrieve the CSRF token from db inside mod_aruba_auth"}
[2021-08-13T10:59:37,183][ERROR][logstash.codecs.json     ][main][171962edfa0cfd61c4a7d15d6f352f1f97843ffcb9f46c020c0a4481b88672af] JSON parse error, original data now in message field {:error=>#<LogStash::Json::ParserError: Unexpected character ('<' (code 60)): expected a valid value (number, String, array, object, 'true', 'false' or 'null')
 at [Source: (String)"<139>Aug 13 10:59:37 2021 MC72-WI-AS1-06-A <MC72-WI-AS1-06-A 172.20.10.10> httpd[21903]: Could not retrieve the CSRF token from db, called from arci_cgi"; line: 1, column: 2]>, :data=>"<139>Aug 13 10:59:37 2021 MC72-WI-AS1-06-A <MC72-WI-AS1-06-A 172.20.10.10> httpd[21903]: Could not retrieve the CSRF token from db, called from arci_cgi"}
[2021-08-13T10:59:37,198][ERROR][logstash.codecs.json     ][main][171962edfa0cfd61c4a7d15d6f352f1f97843ffcb9f46c020c0a4481b88672af] JSON parse error, original data now in message field {:error=>#<LogStash::Json::ParserError: Unexpected character ('<' (code 60)): expected a valid value (number, String, array, object, 'true', 'false' or 'null')
 at [Source: (String)"<139>Aug 13 10:59:37 2021 MC72-WI-AS1-06-A <MC72-WI-AS1-06-A 172.20.10.10> httpd[21903]: Could not retrieve the CSRF token from db inside mod_aruba_auth"; line: 1, column: 2]>, :data=>"<139>Aug 13 10:59:37 2021 MC72-WI-AS1-06-A <MC72-WI-AS1-06-A 172.20.10.10> httpd[21903]: Could not retrieve the CSRF token from db inside mod_aruba_auth"}
[2021-08-13T10:59:37,214][ERROR][logstash.codecs.json     ][main][171962edfa0cfd61c4a7d15d6f352f1f97843ffcb9f46c020c0a4481b88672af] JSON parse error, original data now in message field {:error=>#<LogStash::Json::ParserError: Unexpected character ('<' (code 60)): expected a valid value (number, String, array, object, 'true', 'false' or 'null')
 

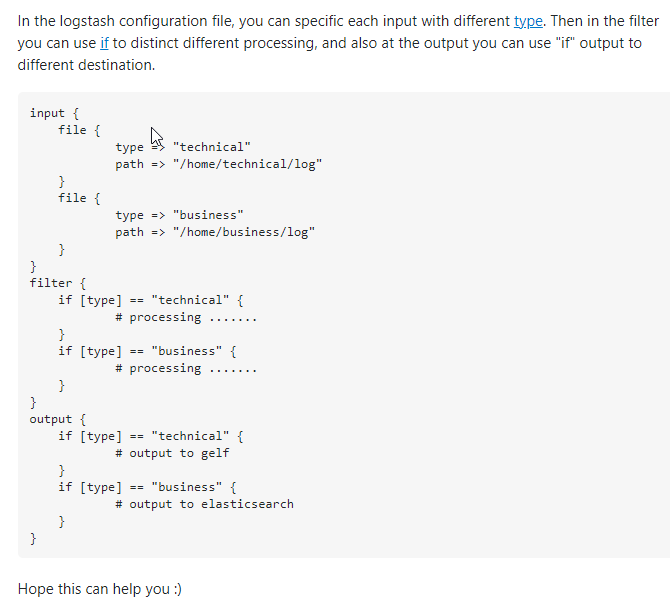
Below is the content of my logstash configuration file :

input {
  udp {
    host => "0.0.0.0"
    port => 514
    codec => "json"
    type => "syslog"
  }
}


# Every single log will be forwarded to ElasticSearch. If you are using another port, you should specify it here.
output {
  if [type] == "syslog" {
    elasticsearch {
      hosts => [ "127.0.0.1:9200" ]
    }
  }
}

If any of you can help me so that I can receive and view these logs on Kibana... Thanks in advance for your help!

Best regards

Hi,

Your values in input seems to don't respect the json format, can you show us the full input data?

Cad.

Are you sure full data are coming in json format ?

I assume there is a json content encaspsulated inside a syslog packet, you should split the syslog part of the log and put the rest in a json filter using grok.

Try to split the message and remove the json codec while listening.

I observed with Wireshark and here is e.g. one of the Syslog messages I get:

message : Aug 16 11:04:44 2021 MC72-WI-AS1-06-A <MC72-WI-AS1-06-A 172.20.10.10> httpd[5592]: Could not retrieve the CSRF token from db, called from arci_cgi

or

message : Aug 16 11:14:16 2021 MC72-WI-AS1-06-A authmgr[3663]: <522267> <3663> <WARN> <MC72-WI-AS1-06-A 172.20.10.10>  MAC=d4:e6:b7:75:86:67 IP=172.20.40.63 Derived unknown role 'Wifi Name' from VSA, authentication=Web

How do I work with the filters to store these messages in elastic? Then the messages I receive will contain source and destination IP addresses, as well as other fields that will allow me to trace the traffic on a wifi network.

But currently, I don't understand how to work with a filter to be able to push the data to Elastic in a correct way for it.

Thanks a lot for your help.

Yes you are right, my WiFi controller sends me Syslog packets. But I can't transform them with the filter and GROK so that they are in a correct format for Elastic.

How can I do this? (I tried to follow some examples on this forum but it doesn't work)

Thanks in advance for your help.

[EDITED]

I just saw your log samples from above, this does not look like JSON data.

For this to work you'll have to use more than one grok as the logs seems to come from different modules / format.

Can you try to parse logs using kibana grok debugger ? then applying those patterns in logstash.

It might be a place to begin, Debug grok expressions | Kibana Guide [7.14] | Elastic

1 Like

Be aware that someone might already have worked on similar patterns, this looks like CISCO wireless AP logs try some patterns online.

Thank you for your advice! I tried to transform my message using GROK. Do you know if there is a way to separate the "<" and ">" characters in my example?

(for example for the IP Address attribute which contains the unwanted ">" character at the end)

Thanks

Sample Data : Aug 16 11:04:44 2021 MC72-WI-AS1-06-A <MC72-WI-AS1-06-A 172.20.10.10> httpd[5592]: Could not retrieve the CSRF token from db, called from arci_cgi

Grok Pattern : %{SYSLOGTIMESTAMP_Aruba:timestamp} %{HOSTNAME:ControllerName} %{NOTSPACE:temp} %{NOTSPACE:IPAddress} %{GREEDYDATA:msg} 

Custom Pattern : SYSLOGTIMESTAMP_Aruba %{MONTH} +%{MONTHDAY} %{TIME} %{YEAR}

Structured Data : 
{
  "msg": "httpd[5592]: Could not retrieve the CSRF token from db, called from arci_cgi",
  "ControllerName": "MC72-WI-AS1-06-A",
  "temp": "<MC72-WI-AS1-06-A",
  "IPAddress": "172.20.10.10>",
  "timestamp": "Aug 16 11:04:44 2021"
}

Hi,

You can use the IP pattern for that.

grok : %{SYSLOGTIMESTAMP_Aruba:timestamp} %{HOSTNAME:ControllerName} <%{NOTSPACE:temp} %{IP:IPAddress}> %{GREEDYDATA:msg} 

But this grok pattern don't respect the second example you give to us:

I think this one should be better :

(?<timestamp>%{MONTH} +%{MONTHDAY} %{TIME} %{YEAR}) %{HOSTNAME:ControllerName} (<%{NOTSPACE} %{IP:IPadress}>|%{NOTSPACE:temp}) %{GREEDYDATA:msg}
1 Like

Hi,

Many thanks for your help. After that I will make sure to have only one type of Syslog message to process.

Now, if I want to use this pattern for my logstash filter, I have to do something like this ?

Or is there another syntax to specify the output of my filter to ElasticSearch?

Thanks again for your help.

input {
  udp {
    host => "0.0.0.0"
    port => 514
    codec => ""  # necessary ?
    type => "syslog"
  }
}

filter {

        if [type] == "syslog" {
                grok {
                        match   =>   {  "message" => "(?<timestamp>%{MONTH} +%{MONTHDAY} %{TIME} %{YEAR}) %{HOSTNAME:ControllerName} (<%{NOTSPACE} %{IP:IPadress}>|%{NOTSPACE:temp}) %{GREEDYDATA:msg}"  }
                }
        }
}


# Every single log will be forwarded to ElasticSearch.
output {
  if [type] == "syslog" {
    elasticsearch {
      hosts => [ "127.0.0.1:9200" ]
    }
  }
}


No

Yes. Just, the first %{NOTSPACE} need to be like this %{NOTSPACE:temp} my mistake.

No but i recommand you to create one index see this and this

Thanks for your answers.

Regarding the indexes, I think it's not entirely clear to me.

Are you talking about an index that is added to each piece of data sent to ElasticSearch to make it easier to search or an "indexPattern" that is always the same to filter where the data comes from?

If I understand correctly, ideally each JSON data sent to Elastic should be indexed and all data coming from this source should have the same "index pattern" so that I can sort from Kibana => Discover from which source the data comes. Is this right?

If so should I add that to my filter directly? Or in the output?

Thanks a lot

I speak about the index who refer to a collection of fields. indexPattern is a kibana option.

Each json data sent to elasticsearch is indexed, if you don't give any custom index, a default index is give to your data (something like logstash-{YYYY-MM-dd} i think)

Index is not only usefull in discorver, let's take one example. If we suppose you have one configuration off logstash who take logs from two differents sources. The logs have the same format, and you want to visualize them together and individually.
Then you gonna create two index in logstash:

  • logs-origin-one-%{YYYY-MM-dd}
  • logs-origin-two-%{YYYY-MM-dd}

In kibana to create visualisation for each index, you have to create two index pattern

  • logs-origin-one*
  • logs-origin-two*

And to create a visualization for both, only one index pattern is needed:

  • logs-origin*

So depending of the complexity of what you want to do in Kibana, you need to do some upstream work to make it easier to set up visualizations.

The configuration of the index is a elasticsearch output plugin option.

output {
  if [type] == "syslog" {
    elasticsearch {
      hosts => [ "127.0.0.1:9200" ]
      index => "index-here"
    }
  }
}
1 Like

If ILM is enabled (and it is on by default if you run recent versions) then the index option is ignored. According to the documentation " The default rollover alias is called logstash , with a default pattern for the rollover index of {now/d}-00001"

2 Likes

Thanks @Cad & @Badger for your answers. :smiley: :muscle:

  1. In my case I use version 7.14.0. So ILM is enabled by default according to the documentation. This means that if I want to use "logs-origin-one" and "logs-origin-two", instead of using this syntax :
output {
  if [type] == "syslog" {
    elasticsearch {
      hosts => [ "127.0.0.1:9200" ]
      index => "index-here"
    }
  }
}

I should use this one ?

output {
  if [type] == "syslog" {
elasticsearch {
      hosts => [ "127.0.0.1:9200" ]
      ilm_rollover_alias => "index-here"
      ilm_pattern => "000001"
    }
  }
}
  1. And after creating my index for my entry N°1 for example, will it automatically appear in the dropdown list on Kibana?

image

Or do I have to add it manually?

  1. When would it be useful to set up an ilm_policy instead of using the default one?

Thanks in advance.

So now I have this logstash configuration file :

input {
  udp {
    host => "0.0.0.0"
    port => 514
    type => "syslog"
  }
}

filter {
	grok {
			match   =>   {  "message" => "(?<timestamp>%{MONTH} +%{MONTHDAY} %{TIME} %{YEAR}) %{HOSTNAME:ControllerName} (<%{NOTSPACE} %{IP:IPadress}>|%{NOTSPACE:temp}) %{GREEDYDATA:msg}"  }
	}
}


# Every single log will be forwarded to ElasticSearch.
output {
  if [type] == "syslog" {
    elasticsearch {
      hosts => [ "127.0.0.1:9200" ]
	  index => "test-1"
    }
  }
}

I have disabled ILM to use the "index" attribute. I reveive message like this :

    Message: Aug 23 11:24:53 2021 MC72-WI-AS1-06-B <MC72-WI-AS1-06-B 172.20.10.11> httpd[19026]: Could not retrieve the CSRF token from db, called from arci_cgi
       

I can see with Wireshark that my message are not rejected, but I don't see anything happening in Kibana ==> Observability ==> Live stream

Does anyone see my problem?

I have tested my filter with the GROK debugger and all seems to be good.

I would like to have these logs filed in the index-pattern "test-1" in this case. (In Kibana ==> Analytics ==> Discover)

Thanks in advance for your help.

Hi,

First i recommand you to verify that logstash work well. To do that you have to check the logstash logs.

If you are sure that the logs are being transferred to kibana, then you have to create an index pattern to visualize it in discorver. You have a tutorial on elasticsearch website https://www.elastic.co/guide/en/kibana/current/index-patterns.html

1 Like

Thanks for your help! It finally works!

I just have one more small general question: now that I have a working instance of ElasticSearch, Kibana and Logstash. How do I manage 2 Syslog data sources?

For example, if I have a router and a firewall sending me Syslog data, I will have 2 Logstash configuration files?

How to make my Logstash configuration file for the firewall manage only the syslog entries from the firewall and my router configuration file manage only the syslog entries from the router?

Should I play with port numbers and use one port number per syslog source (e.g. my firewall will send syslog data on port 514 and the router on 515 to keep the sources separate)?

Or is there another way? Because each source will have its own config file for Logstash with grok parser...

Thanks in advance for this clarification !

Here is the solution to my last question.

I hope it can help other people too.

Thank you all for your help.

This topic was automatically closed 28 days after the last reply. New replies are no longer allowed.