Gotcha, that's what we were thinking... I've purged some indices and now all indices have been fully replicated 

Including the .enrich-enrich_vessel? is there a p and r on separate nodes
So at this point you should have 2 hot nodes with the .enrich- ... shard on each node right?
Curious if the field you are matching on is a keyword only in both the enrich index and the track in dex
"field": "mmsi",
Also How big are each of those track-000032 indices how big do expect them to be?
Can you do a _cat/indices?v one of those?
# GET _cat/shards/.e*?v
index                               shard prirep state     docs  store ip            node
.enrich-enrich_vessel-1609893468927 0     r      STARTED 361842 24.7mb 172.25.70.33  instance-0000000021
.enrich-enrich_vessel-1609893468927 0     p      STARTED 361842 24.7mb 172.25.84.100 instance-0000000013

# GET .enrich-enrich_vessel-1609893468927/_mapping
{
  ".enrich-enrich_vessel-1609893468927" : {
    "mappings" : {
      "dynamic" : "false",
      "_meta" : {
        "enrich_policy_name" : "enrich_vessel",
        "enrich_readme" : "This index is managed by Elasticsearch and should not be modified in any way.",
        "enrich_policy_type" : "match",
        "enrich_match_field" : "mmsi"
      },
      "properties" : {
        "mmsi" : {
          "type" : "keyword",
          "doc_values" : false
        }
      }
    }
  }
}

# GET vessel-000001/_mapping
...
"mmsi" : {
  "type" : "keyword"
},
...

# GET track-000032/_mapping
...
"mmsi" : {
  "type" : "keyword"
},
...
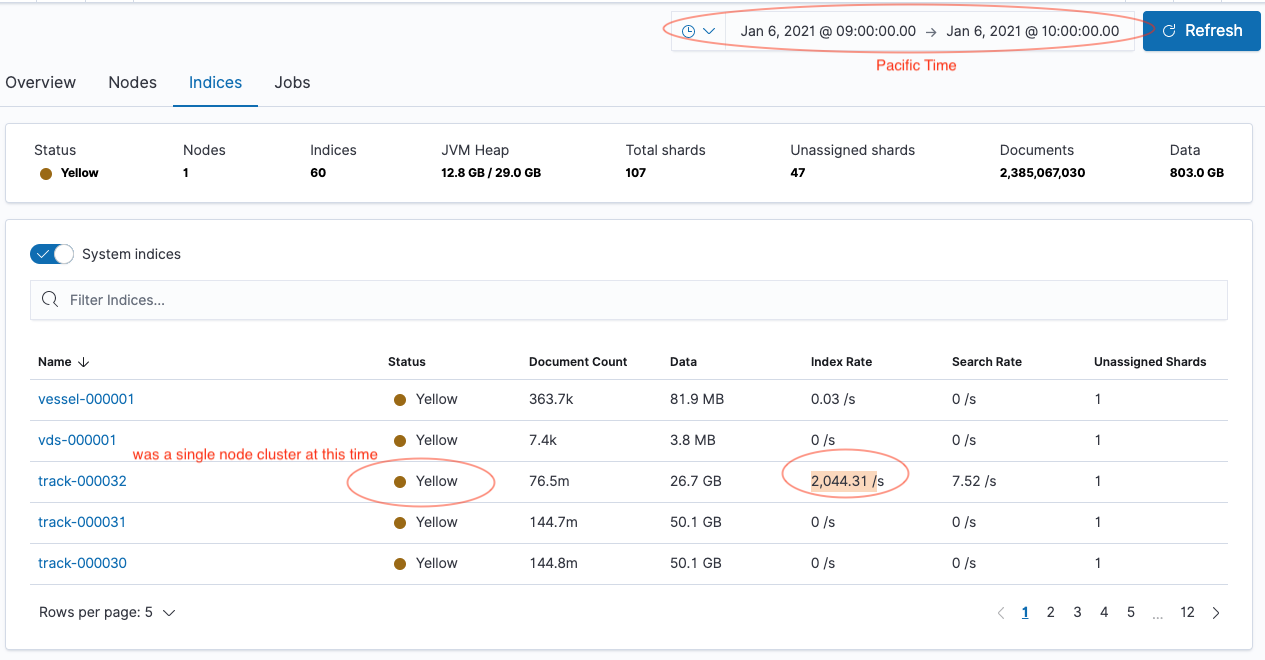
Each track index can grow to 50Gb but deleted after 7 days via ILM
# GET _cat/indices/track-000032?v
health status index        uuid                   pri rep docs.count docs.deleted store.size pri.store.size
green  open   track-000032 JjLw6xnVRpqekY9okrFFyQ   1   1   91951733            0     64.1gb           32gb
OK Good...
Everything looking pretty good / nominal.
Index / Shard Size is OK 32-50GB, in the middle of recommended, depending on performance need they could perhaps be tuned, but good now.
Average doc size pretty nominal about 400 Bytes
Curious:
What size nodes?
So how do you actually ingest the data, what tool?
Is it bulk or per document, do you use logstash, something else?
I notice that index.refresh_interval appears to not be set, so it should be defaulting to 1s, depending on requirement you could move that up to 10s or something that helps indexing speed.
There are also some advanced setting that we can check like these but assuming you have not been in the guts turning nobs we wont look at them now.
At this point I would expect the loading and enriching to work as planned with the enrich 2 nodes to be essentially the same as 1 node with the very minor overhead of writing the replica.
Want to give a test and report back?
I have 2x 58Gb nodes in the same AZ. Ingesting via Filebeats (as per config posted above) with bulk_max_size: 1000
My report is that we are already seeing data inconsistency and it's only been an hour since introducing the new node into the cluster. By tomorrow, we'll see a slope much like the one I posted initially...
Here is an updated screenshot showing that eventually the events get backfilled:
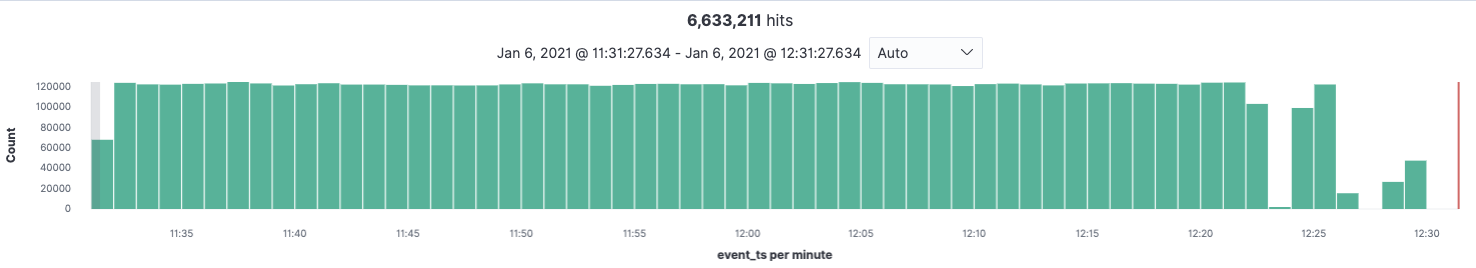
Perhaps I should update the index.refresh_interval? 10s should be totally fine for our use case.
Hmmm / Interesting...
Curious why in the same AZ instead of 2 AZs?
Curious which cloud Provided and Region?
What do the filebeat logs show?
Share you filebeat config? Ohh I see partial
Yes you can set refresh_interval is is dynamic
What happens if you remove the pipeline...
Also can you run
GET _cat/thread_pool?v
While it is degraded...
I did this before and when I removed the pipeline in the Filebeat config, all was fine.
To eliminate any possible latency overhead via the network across the data centers.
AWS us-east-1
Anything in particular I should be looking for in the Filebeat logs?
node_name           name                active queue rejected
instance-0000000021 analyze                  0     0        0
instance-0000000021 fetch_shard_started      0     0        0
instance-0000000021 fetch_shard_store        0     0        0
instance-0000000021 flush                    0     0        0
instance-0000000021 force_merge              0     0        0
instance-0000000021 generic                  0     0        0
instance-0000000021 get                      0     0        0
instance-0000000021 listener                 0     0        0
instance-0000000021 management               1     0        0
instance-0000000021 ml_datafeed              0     0        0
instance-0000000021 ml_job_comms             0     0        0
instance-0000000021 ml_utility               0     0        0
instance-0000000021 refresh                  0     0        0
instance-0000000021 rollup_indexing          0     0        0
instance-0000000021 search                   0     0        0
instance-0000000021 search_throttled         0     0        0
instance-0000000021 security-crypto          0     0        0
instance-0000000021 security-token-key       0     0        0
instance-0000000021 snapshot                 0     0        0
instance-0000000021 transform_indexing       0     0        0
instance-0000000021 warmer                   0     0        0
instance-0000000021 watcher                  0     0        0
instance-0000000021 write                    1     0        0
instance-0000000013 analyze                  0     0        0
instance-0000000013 fetch_shard_started      0     0        0
instance-0000000013 fetch_shard_store        0     0        0
instance-0000000013 flush                    0     0        0
instance-0000000013 force_merge              0     0        0
instance-0000000013 generic                  0     0        0
instance-0000000013 get                      0     0        0
instance-0000000013 listener                 0     0        0
instance-0000000013 management               1     0        0
instance-0000000013 ml_datafeed              0     0        0
instance-0000000013 ml_job_comms             0     0        0
instance-0000000013 ml_utility               0     0        0
instance-0000000013 refresh                  0     0        0
instance-0000000013 rollup_indexing          0     0        0
instance-0000000013 search                   0     0        0
instance-0000000013 search_throttled         0     0        0
instance-0000000013 security-crypto          0     0        0
instance-0000000013 security-token-key       0     0        0
instance-0000000013 snapshot                 0     0        0
instance-0000000013 transform_indexing       0     0        0
instance-0000000013 warmer                   0     0        0
instance-0000000013 watcher                  0     0        0
instance-0000000013 write                    1     0        0
that looks good... assuming that is is in the "degraded mode" I would have expected to see some higher numbers in the write queue or rejected...
Definitely changing the refresh interval can help
I think we should try adjusting a couple filebeat settings.
worker and bulk_max_size
Generally I am not big on turning 2 nobs at once.
First perhaps take out the bulk_max_size and see what happens.... this will set it deafult of 50...
What Happens.
Then you could try something this 4 thread 200 each,
don't over read the docs on the workers.
output.elasticsearch:
  bulk_max_size: 200
  worker: 4
Also Do you have monitoring one.. cluster monitoring to another cluster?
That way we could see the CPU / Heap Write Speeds etc...

In filebeat you could look for bulk rejection 429s I think.
Ohhh how many filebeats are shipping logs 1...100?
- The 2 nodes instance-0000000021 & instance-0000000013 both have ingest role ?
- Did you tried to point filebeat to both nodes ? (output.elasticsearch.hosts: ["node1:9200", "node2:9200"]
Good thinking but this is Elastic Cloud so there is only an endpoint that is proxied you don't write directly to nodes.
These should both be ingest but he can run the following and we can see.
GET _cat/nodes?v
GET _cat/nodeattrs


Just one docker container running Filebeats, listening to the stdout from another container in AWS ECS.
# GET _cat/nodes?v
ip            heap.percent ram.percent cpu load_1m load_5m load_15m node.role master name
172.25.84.100           11          92 100    4.14    4.61     4.94 dimrt     *      instance-0000000013
172.25.70.33            65          92 100    2.15    1.97     2.01 dimrt     -      instance-0000000021

# GET _cat/nodeattrs
instance-0000000021 172.25.70.33  172.25.70.33  logical_availability_zone zone-0
instance-0000000021 172.25.70.33  172.25.70.33  server_name               instance-0000000021.ade82767ae9248d683808a6eb0cc48b4
instance-0000000021 172.25.70.33  172.25.70.33  availability_zone         us-east-1b
instance-0000000021 172.25.70.33  172.25.70.33  xpack.installed           true
instance-0000000021 172.25.70.33  172.25.70.33  instance_configuration    aws.data.highio.i3
instance-0000000021 172.25.70.33  172.25.70.33  transform.node            true
instance-0000000021 172.25.70.33  172.25.70.33  region                    us-east-1
instance-0000000013 172.25.84.100 172.25.84.100 logical_availability_zone zone-0
instance-0000000013 172.25.84.100 172.25.84.100 server_name               instance-0000000013.ade82767ae9248d683808a6eb0cc48b4
instance-0000000013 172.25.84.100 172.25.84.100 availability_zone         us-east-1b
instance-0000000013 172.25.84.100 172.25.84.100 xpack.installed           true
instance-0000000013 172.25.84.100 172.25.84.100 instance_configuration    aws.data.highio.i3
instance-0000000013 172.25.84.100 172.25.84.100 transform.node            true
instance-0000000013 172.25.84.100 172.25.84.100 region                    us-east-1
All nodes get the ingest label by default... including warm nodes unfortunately ![]()
I have just removed the bulk_max_size from Filebeats and I'll report back here what happens...
Ok from above those are just the hot nodes, I do not see any warm nodes... but lets get back to hot / warm later... This cluster right now is just 2 hot nodes correct?
Those nodes look absolutely pegged CPU...
# GET _cat/nodes?v
ip            heap.percent ram.percent cpu load_1m load_5m load_15m node.role master name
172.25.84.100           11          92 100    4.14    4.61     4.94 dimrt     *      instance-0000000013
172.25.70.33            65          92 100    2.15    1.97     2.01 dimrt     -      instance-0000000021
What do the nodes look like when you go to monitoring click on the node tab and pick one of those data nodes. What else is going on on them?
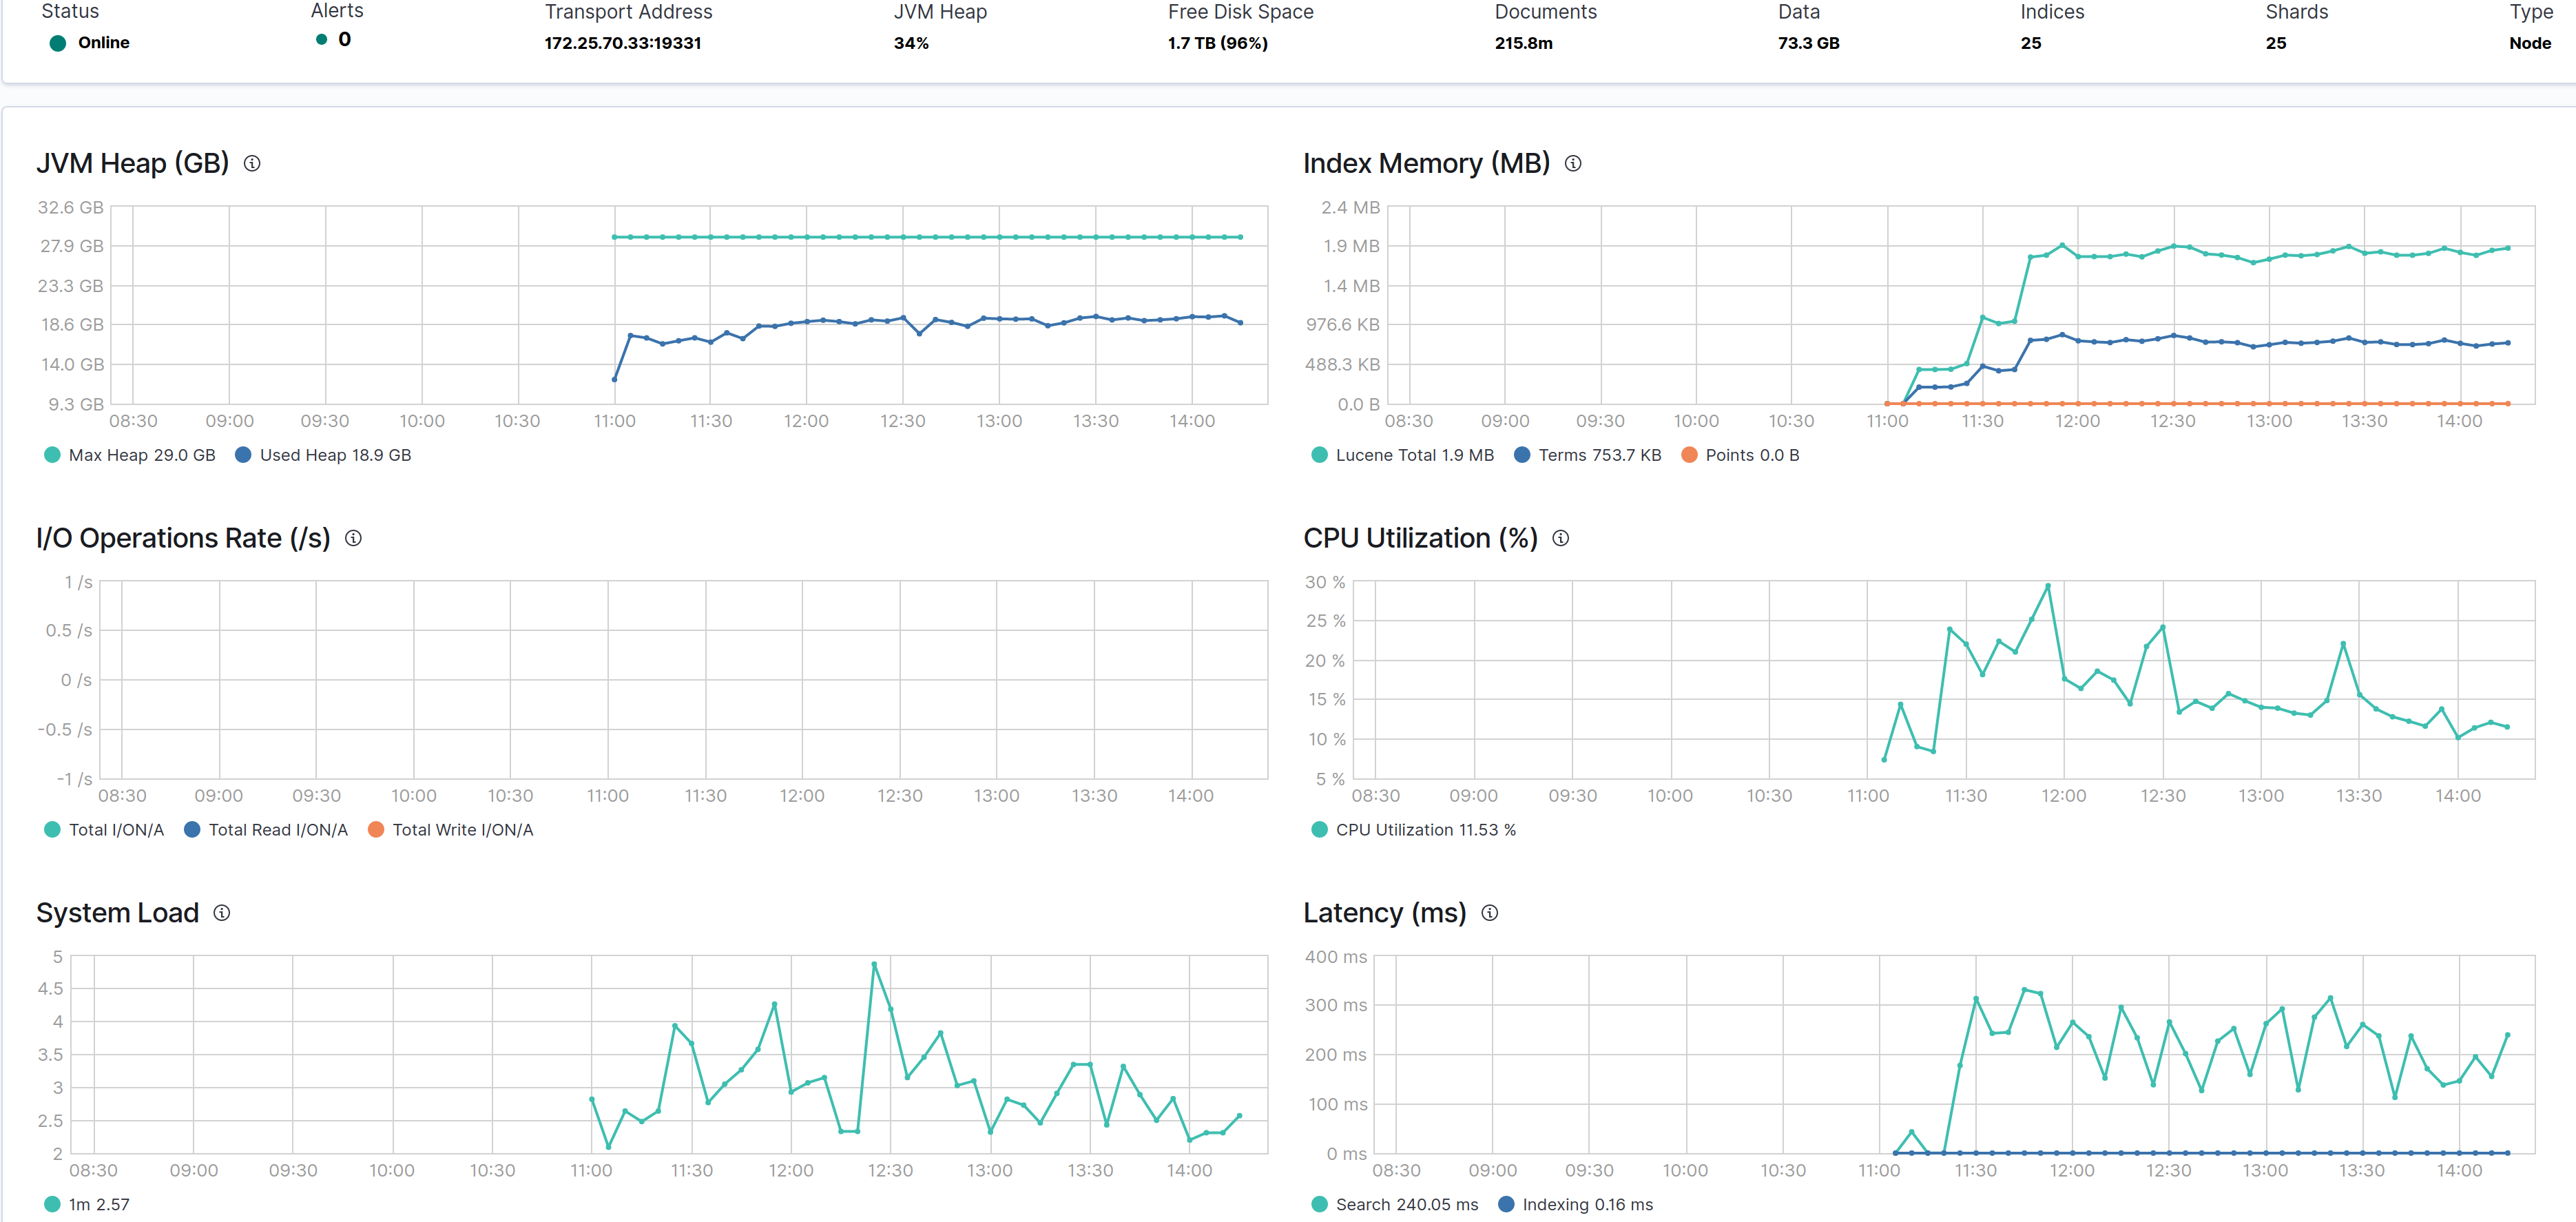

Here is the original nodes' advanced tab:

Have a look at the latency spike on this node after adding a node to the cluster...
Yes, just dealing with the hot only nodes for now...
When I drill down into the monitoring cluster, the CPU remains around 20%... I'm not sure why the _cat/nodes is showing 100 for cpu
@Alain_St_Pierre I DM'd you.