@javadevmtl do you know which backend cinder is using?
The Block Storage (cinder) service manages volumes on storage devices in an environment. In a production environment, the device presents storage via a storage protocol (for example, NFS, iSCSI, or Ceph RBD) to a storage network (br-storage) and a storage management API to the management network (br-mgmt). Instances are connected to the volumes via the storage network by the hypervisor on the Compute host.
We are using KVM hypervisor with Cinder and iSCSI over a 10 Gigabit network.
Also, I have just turned on monitoring on my "application" nodes. The ones that have the most active activity, also the ones who seem to be stable but have more RAM then the rest of the nodes.
Indeed we are @javadevmtl, we are a few people from elastic in montreal.
We would like to push debugging this problem further but we will need to take special mean to do it.
From what we understand is the data read from the disk is just buffered into our streambuf type until the process goes OOM.
The problem that we have is we have debug logs but they are only available after a line tokenization is done, in your case it appear that we never see a newline, so we never reach any other trace that we have in place.
The only theory that we have is that the Filesystem is indeed not returning what we are expecting it could still always returning a null bytes.
I am working to add debug information before the tokenization process, would you be interested in testing a special build once its available.
Also, I have just turned on monitoring on my "application" nodes. The ones that have the most active activity, also the ones who seem to be stable but have more RAM then the rest of the nodes.
For debugging: Ok. I'm running 6.4.2. Let me know when it's ready...
I do not think the boxes are over provisioned. I'm running DC/OS and I initially setup Filebeat based on: https://docs.mesosphere.com/1.11/monitoring/logging/aggregating/elk/ the nodes that seem to have more problems are the master nodes, which run Zookeeper and my Kafka nodes, but they are all 4 cores and 32GB machines. The application nodes have 16cores and 64GB RAM, they run all the docker applications.
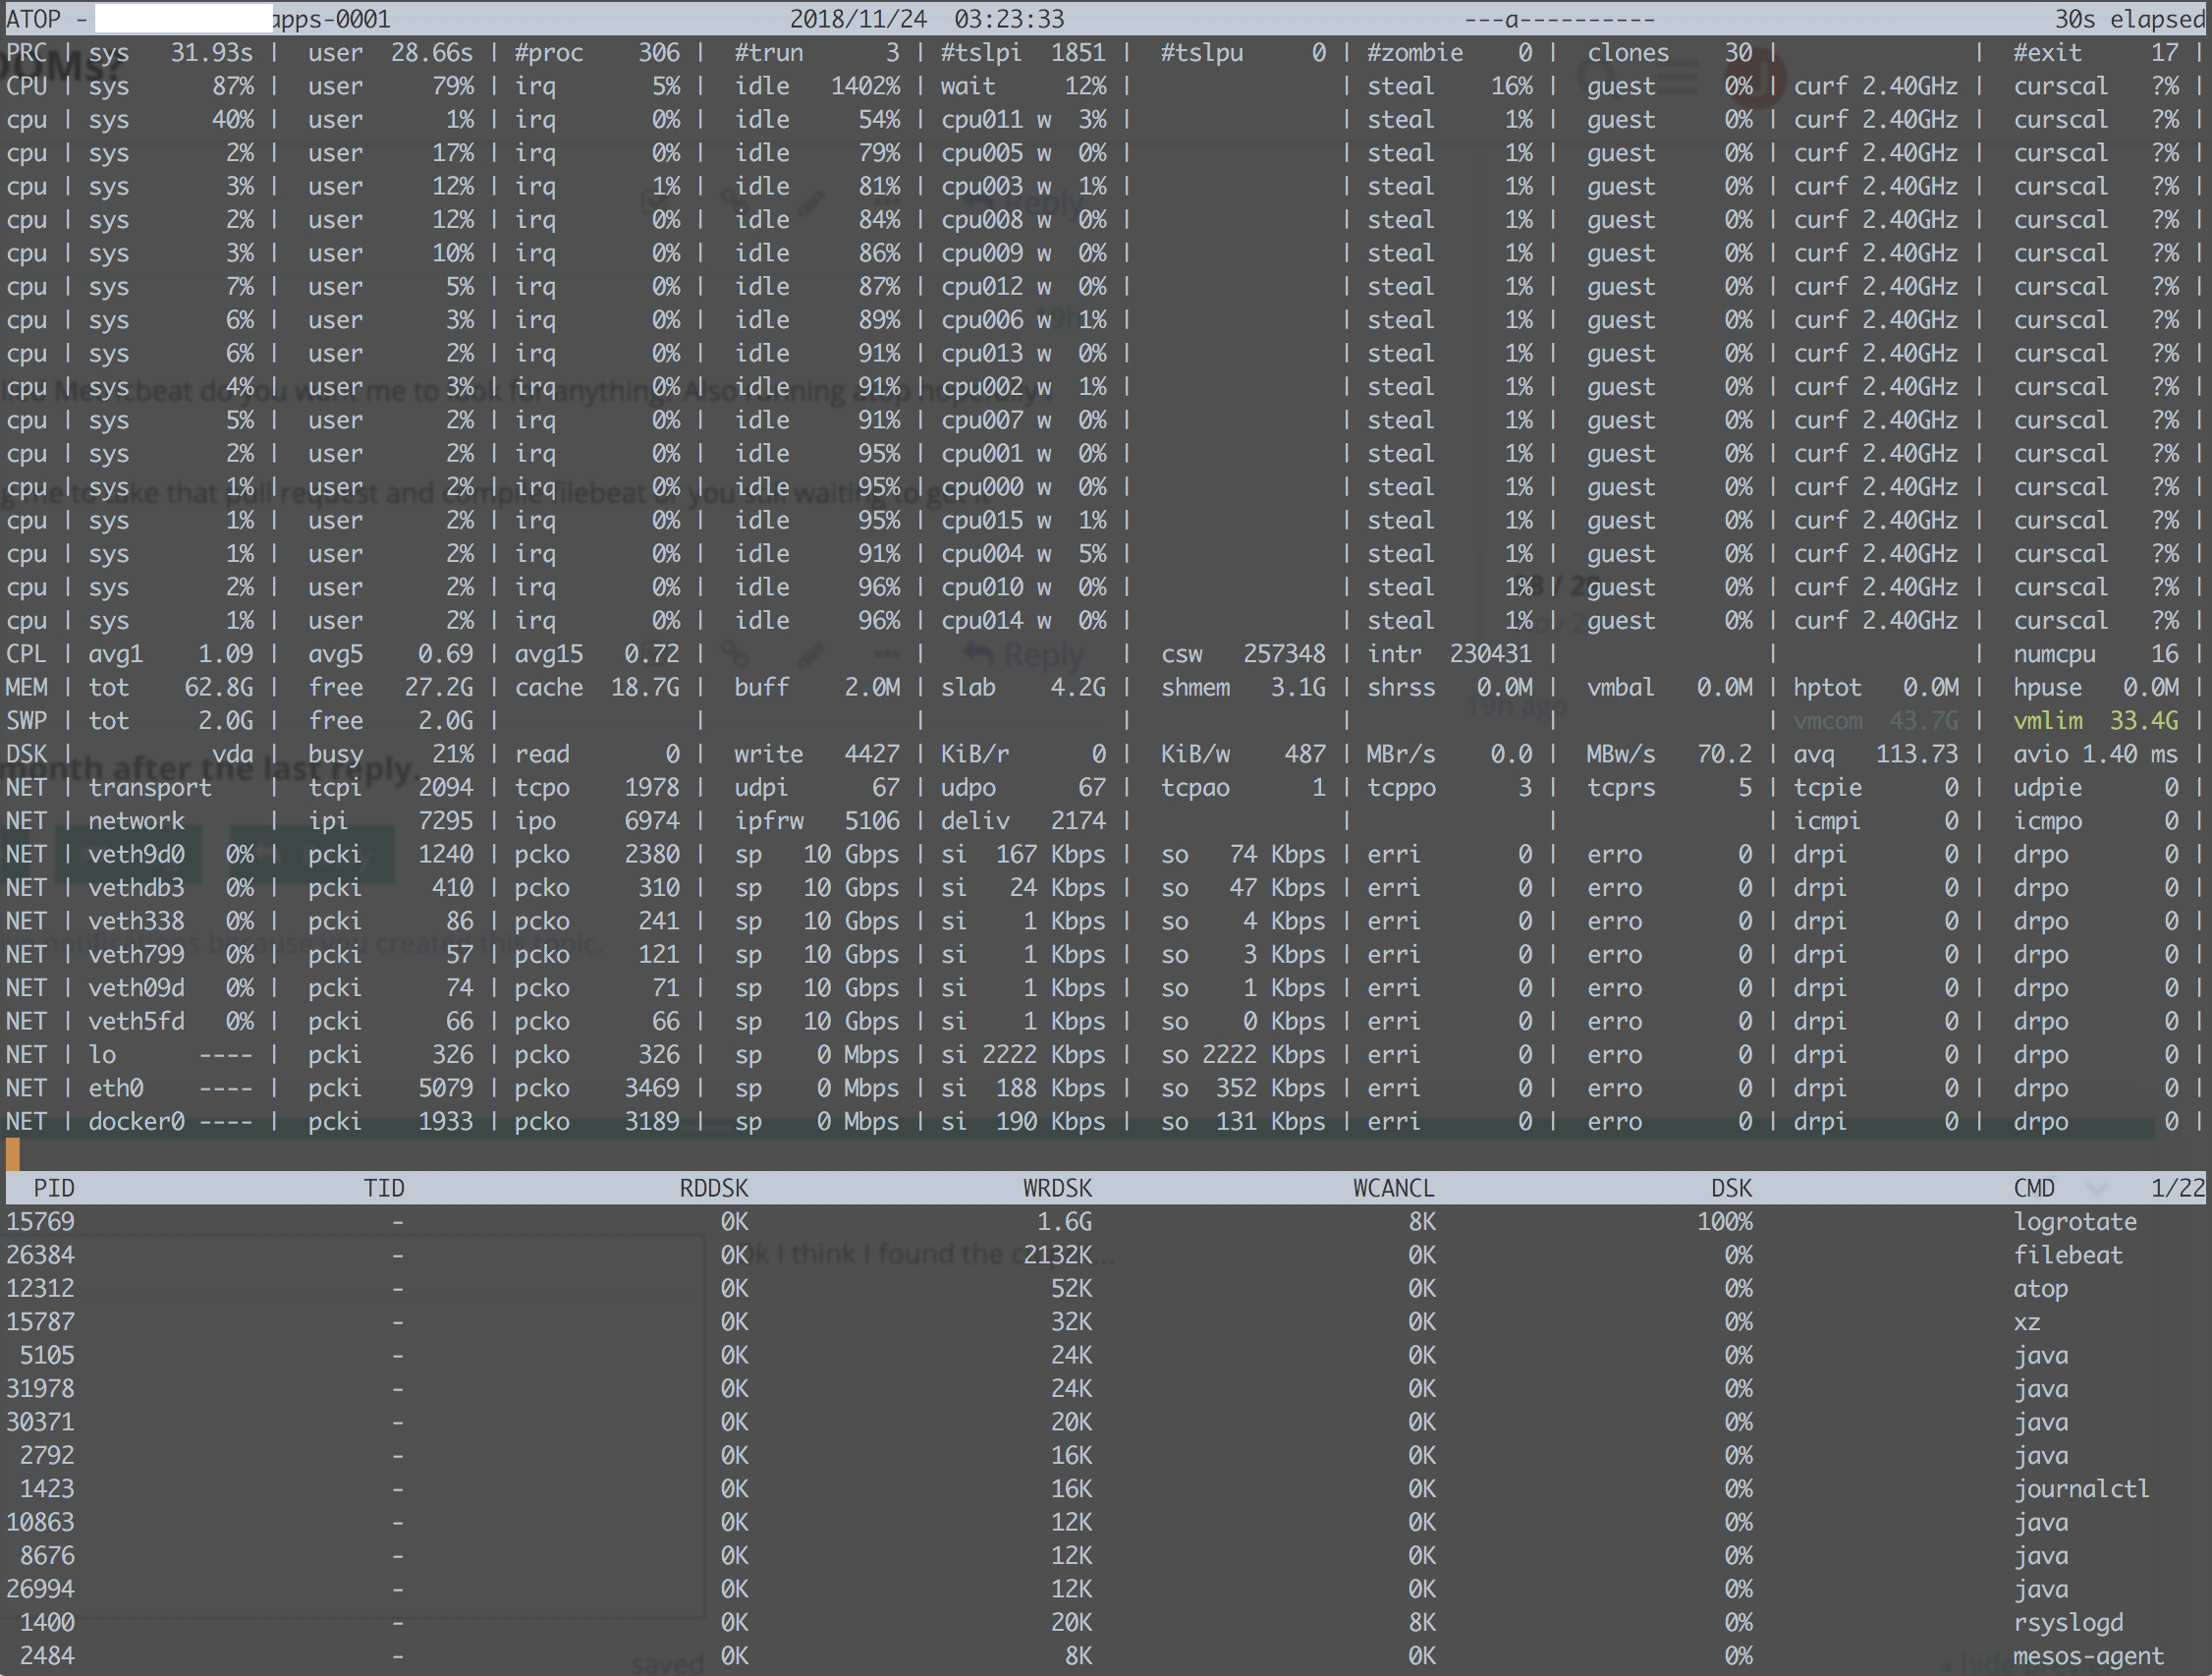
I may have found a pattern, the issue seems to happen around 10PM eastern all the time. So maybe log rotation or some job?
Would you be down to do a lunch and debug session, since we are close?
Here is a screen of one of the application nodes, with a peak of 1000 events per second and the RAM was only 50MB. Also I have been able to index many 1000s of events per second, through Filebeat, Kafka, Logstash and Elasticsearch.
Ok so on the "application" VMs which have more resources and seem stable, the spikes also happened with only around 5GB usage. I guess there's enough resources on the machine to handle the spike.
But I have noticed a pattern at 10PM every night the spikes happen on all nodes. Some are short lived some spikes last for hours.
Maybe log rotation? DC/OS configures logrotate and it's size based 100MB and the application constantly rotate so not sure it's that...
So this file grows to a few gigabytes. When you guys asked me about log rotation I didn't realize that logrotate runs daily. I was thinking that it would rotate every 100MB, but in reality it rotates every night if it's greater then 100MB.
I will switch logrotate to hourly and see what happens.
So @pierhugues and @steffens so given the situation does this still affect Filebeat?
Ouch copytruncate. copytruncate should be your last resort if your application does not support proper log rotation and does not support any kind signalling by logrotate. Having logrotate in place you have 3 processes working on a shared file. And each process is subject to races, yay. When using copytruncate your application still writes to the old log. That is, logs go missing and when doing the truncate, incomplete logs might appear at the top of the truncated log file. If all you need is to look at the file from time to time, you don't care much about incomplete/dropped logs at the beginning of your log file. But in automated environments shipping log files, this can indeed be a problem (data-loss, log lines can not be parsed, incomplete stack-traces...).
Filebeat detects if a file is truncated. Inside the kernel, each file descriptor has an additional read pointer, such that 'read' will advance through the file. Once you truncate, a call to read should return with an error. Filebeat checks that read returns and also checks the file size. It tries to detect a file being truncated.
If you run filebeat with debug log enabled, you should find lines saying File was truncated at offset in your logs. There should also be a metric named filebeat.input.log.files.truncated in the monitoring index. If you can't find these lines or if the metric is 0, then something is off about truncate-detection (e.g. not reported correctly to user-space applications?).
If you find filebeat detects files being truncated, you could try to enable close_truncate: true, to force filebeat to reopen a file if it has been truncated. And pray no other caching effects are in place.
Basically DC/OS services write to journalctl and then those are streamed to /var/log/dcos/dcos.log via journalctl bash script.
Also I have moved to hourly logs and so far it seems ok. The DCOS log was 2G in size maybe that could have affected it also? I deleted it so now we have to wait until it grows to at least 100MB to see it rotate.
I'm a bit confused. Where do I find the filebeat.input.log.files.truncated field? In .monitoring-beats-6-? I do not have a filebeat- index at all as I put the logs in individual indexes per application.
If copytruncate is used and size is 100MB shouldn't the file size stay at 100MB? The file has grown to 8GB. So maybe that is what's causing the resource issue?
Looking at the DC/OS Journald, we just released an experimental beats called Journalbeat, which actually read journald files natively, I wonder if that could you and remove some of the problem you are having.
Ok cool. So @pierhugues and @steffens. I think I have pin pointed exactly the issue.
DC/OS writes to journald. There's a service that streams journal logs to log file using: ExecStart=/bin/sh -c '/bin/journalctl --since="5 minutes ago" --no-tail --follow --unit="dcos*.service" >> /var/log/dcos/dcos.log 2>&1'
Looking at the dcos.log files they are in the gigabytes of size. I did some testing with logrotate and even though it indicates that it truncated the file it didn't. So I then stopped the service that "appends" to the file and ran logrotate again and the file truncated properly. At first glance the above command should be appending to the file so it shouldn't be an issue.
sudo logrotate -v /etc/logrotate.d/dcos
reading config file /etc/logrotate.d/dcos
compress_prog is now /bin/xz
Allocating hash table for state file, size 15360 B

Handling 1 logs

rotating pattern: /var/log/dcos/dcos.log  104857600 bytes (5 rotations)
empty log files are rotated, old logs are removed
considering log /var/log/dcos/dcos.log
  log needs rotating
rotating log /var/log/dcos/dcos.log, log->rotateCount is 5
dateext suffix '-20181126'
glob pattern '-[0-9][0-9][0-9][0-9][0-9][0-9][0-9][0-9]'
renaming /var/log/dcos/dcos.log.5.gz to /var/log/dcos/dcos.log.6.gz (rotatecount 5, logstart 1, i 5),
old log /var/log/dcos/dcos.log.5.gz does not exist
renaming /var/log/dcos/dcos.log.4.gz to /var/log/dcos/dcos.log.5.gz (rotatecount 5, logstart 1, i 4),
old log /var/log/dcos/dcos.log.4.gz does not exist
renaming /var/log/dcos/dcos.log.3.gz to /var/log/dcos/dcos.log.4.gz (rotatecount 5, logstart 1, i 3),
old log /var/log/dcos/dcos.log.3.gz does not exist
renaming /var/log/dcos/dcos.log.2.gz to /var/log/dcos/dcos.log.3.gz (rotatecount 5, logstart 1, i 2),
old log /var/log/dcos/dcos.log.2.gz does not exist
renaming /var/log/dcos/dcos.log.1.gz to /var/log/dcos/dcos.log.2.gz (rotatecount 5, logstart 1, i 1),
renaming /var/log/dcos/dcos.log.0.gz to /var/log/dcos/dcos.log.1.gz (rotatecount 5, logstart 1, i 0),
old log /var/log/dcos/dcos.log.0.gz does not exist
log /var/log/dcos/dcos.log.6.gz doesn't exist -- won't try to dispose of it
copying /var/log/dcos/dcos.log to /var/log/dcos/dcos.log.1
truncating /var/log/dcos/dcos.log
compressing log with: /bin/xz
I've created the following artifact from a 6.x branch (6.6.0) that includes the new logger, to turn it on either start Filebeat with -d "detect_null_bytes" or configure the debug selector in the configuration: logging.selectors: ["detect_null_bytes"], if we detect null bytes you should see your log a statement similar to this "Matching null byte found at"
Looking at the dcos.log files they are in the gigabytes of size. I did some testing with logrotate and even though it indicates that it truncated the file it didn't. So I then stopped the service that "appends" to the file and ran logrotate again and the file truncated properly. At first glance the above command should be appending to the file so it shouldn't be an issue.
OK, but I am not sure it explains why we keep buffering the data, unless when the rotation happend the file just return garbage data.
Apache, Apache Lucene, Apache Hadoop, Hadoop, HDFS and the yellow elephant
logo are trademarks of the
Apache Software Foundation
in the United States and/or other countries.