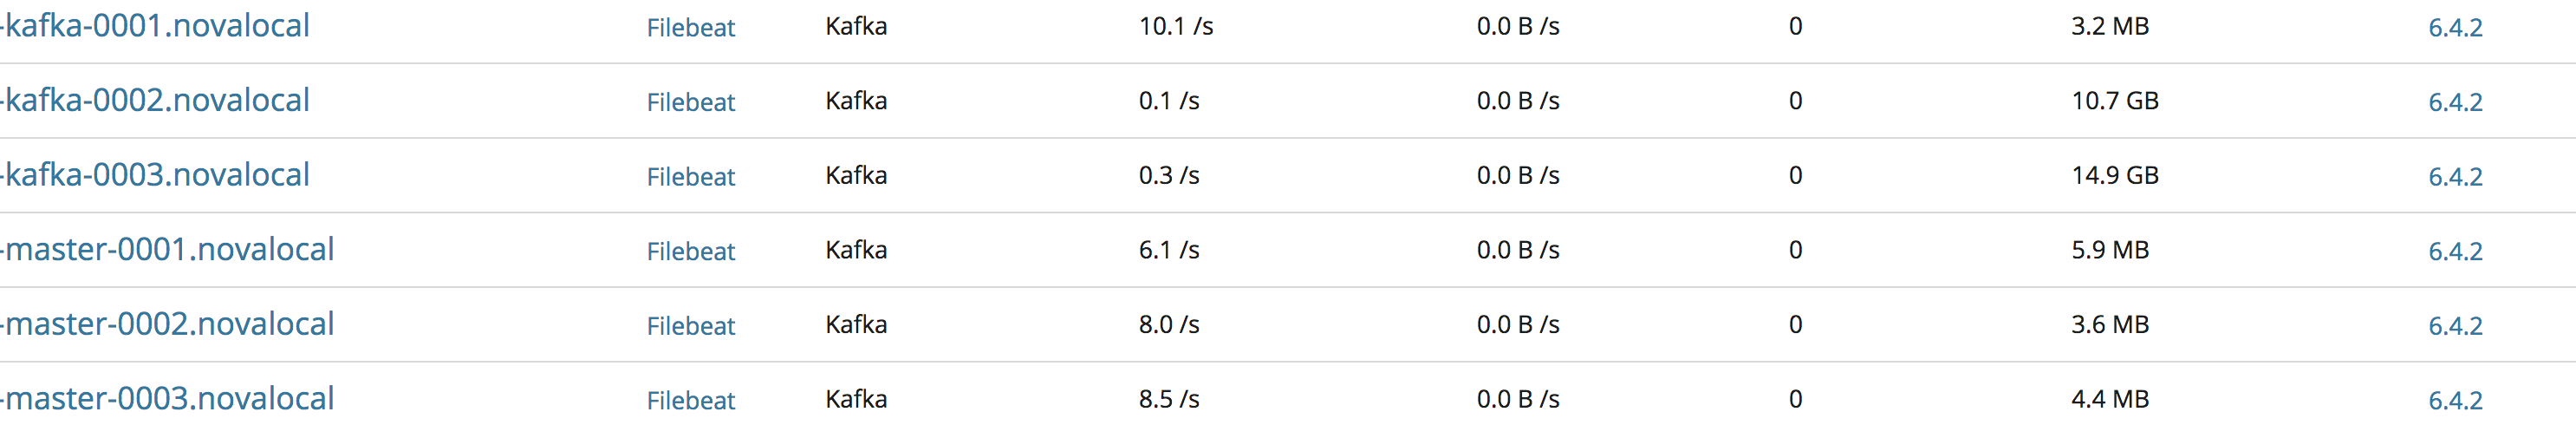
Filbeat still OOMs?

Hi, running 6.4.2

I see this in my /var/log/messages

Nov 11 18:49:37 xxxxxx-0002 systemd: filebeat.service: main process exited, code=exited, status=2/INVALIDARGUMENT
Nov 11 18:49:37 xxxxxx-0002 systemd: Unit filebeat.service entered failed state.
Nov 11 18:49:37 xxxxxx-0002 systemd: filebeat.service failed.
Nov 11 18:49:38 xxxxxx-0002 systemd: filebeat.service holdoff time over, scheduling restart.
Nov 11 18:50:20 xxxxxx-0002 kernel: [21658] 0 21658 3747640 3650216 7166 1 0 filebeat
Nov 11 18:50:20 xxxxxx-0002 kernel: [21658] 0 21658 3747640 3651148 7168 28 0 filebeat
Nov 11 18:50:20 xxxxxx-0002 kernel: [21658] 0 21658 3747640 3654834 7175 28 0 filebeat
Nov 11 18:50:20 xxxxxx-0002 kernel: [21658] 0 21658 3747640 3655690 7177 28 0 filebeat
Nov 11 18:50:20 xxxxxx-0002 kernel: [21658] 0 21658 3747640 3655685 7177 33 0 filebeat
Nov 11 18:55:40 xxxxxx-0002 kernel: [21658] 0 21658 3976276 3849259 7623 18036 0 filebeat
Nov 11 18:55:47 xxxxxx-0002 kernel: [21658] 0 21658 3976276 3849256 7623 18039 0 filebeat
Nov 11 18:55:47 xxxxxx-0002 kernel: [21658] 0 21658 3976276 3849230 7623 18065 0 filebeat
Nov 11 18:55:54 xxxxxx-0002 kernel: [21658] 0 21658 3976276 3849072 7623 18223 0 filebeat
Nov 11 18:55:54 xxxxxx-0002 kernel: [21658] 0 21658 3976276 3849063 7623 18232 0 filebeat
Nov 11 19:03:57 xxxxxx-0002 kernel: [21658] 0 21658 4002812 3744999 7637 45191 0 filebeat
Nov 11 19:10:58 xxxxxx-0002 kernel: [21658] 0 21658 4002812 3646305 7636 50770 0 filebeat
Nov 11 19:13:22 xxxxxx-0002 kernel: [21658] 0 21658 4002812 3645069 7637 55020 0 filebeat
Nov 11 19:13:27 xxxxxx-0002 kernel: [21658] 0 21658 4002812 3645049 7637 55040 0 filebeat
Nov 11 19:17:12 xxxxxx-0002 kernel: [21658] 0 21658 4002812 3641613 7637 58522 0 filebeat
Nov 11 19:17:12 xxxxxx-0002 kernel: filebeat invoked oom-killer: gfp_mask=0x201da, order=0, oom_score_adj=0
Nov 11 19:17:12 xxxxxx-0002 kernel: filebeat cpuset=/ mems_allowed=0
Nov 11 19:17:12 xxxxxx-0002 kernel: CPU: 0 PID: 21665 Comm: filebeat Kdump: loaded Tainted: G W ------------ 3.10.0-862.3.2.el7.x86_64 #1
Nov 11 19:17:12 xxxxxx-0002 kernel: [21658] 0 21658 4002812 3641509 7637 58626 0 filebeat
Nov 11 19:17:13 xxxxxx-0002 kernel: [21658] 0 21658 4002812 3641509 7637 58626 0 filebeat
Nov 11 19:17:13 xxxxxx-0002 kernel: [21658] 0 21658 4002812 3641485 7637 58650 0 filebeat
Nov 11 19:17:13 xxxxxx-0002 kernel: filebeat invoked oom-killer: gfp_mask=0x201da, order=0, oom_score_adj=0
Nov 11 19:17:13 xxxxxx-0002 kernel: filebeat cpuset=/ mems_allowed=0
Nov 11 19:17:13 xxxxxx-0002 kernel: CPU: 0 PID: 21659 Comm: filebeat Kdump: loaded Tainted: G W ------------ 3.10.0-862.3.2.el7.x86_64 #1
Nov 11 19:17:13 xxxxxx-0002 kernel: [21658] 0 21658 4002812 3641466 7637 58669 0 filebeat
Nov 11 19:17:13 xxxxxx-0002 kernel: [21658] 0 21658 4002812 3641455 7637 58680 0 filebeat
Nov 11 19:17:13 xxxxxx-0002 kernel: [21658] 0 21658 4002812 3641410 7637 58725 0 filebeat
Nov 11 19:17:13 xxxxxx-0002 kernel: [21658] 0 21658 4002812 3641405 7637 58730 0 filebeat
Nov 11 19:17:13 xxxxxx-0002 kernel: [21658] 0 21658 4002812 3641391 7637 58744 0 filebeat
Nov 11 19:17:14 xxxxxx-0002 kernel: [21658] 0 21658 4002812 3641330 7637 58805 0 filebeat

And here is the last metrics:

2018-11-11T19:19:08.202Z INFO [monitoring] log/log.go:141 Non-zero metrics in the last 30s {"monitoring": {"metrics": {"beat":{"cpu":{"system":{"ticks":41380,"time":{"ms":5}},"total":{"ticks":110240,"time":{"ms":21},"value":110240},"user":{"ticks":68860,"time":{"ms":16}}},"info":{"ephemeral_id":"07c894b6-6a13-47ef-a2af-7e3eae818b0e","uptime":{"ms":1770040}},"memstats":{"gc_next":163008880,"memory_alloc":152316592,"memory_total":49717784168,"rss":245760}},"filebeat":{"events":{"added":10,"done":10},"harvester":{"open_files":1,"running":1}},"libbeat":{"config":{"module":{"running":0}},"output":{"events":{"acked":10,"batches":1,"total":10}},"outputs":{"kafka":{"bytes_read":400,"bytes_write":5129}},"pipeline":{"clients":2,"events":{"active":0,"published":10,"total":10},"queue":{"acked":10}}},"registrar":{"states":{"current":1,"update":10},"writes":{"success":1,"total":1}},"system":{"load":{"1":17.53,"15":49.7,"5":53.97,"norm":{"1":4.3825,"15":12.425,"5":13.4925}}}}}}
2018-11-11T19:19:38.201Z INFO [monitoring] log/log.go:141 Non-zero metrics in the last 30s {"monitoring": {"metrics": {"beat":{"cpu":{"system":{"ticks":41400,"time":{"ms":17}},"total":{"ticks":110320,"time":{"ms":79},"value":110320},"user":{"ticks":68920,"time":{"ms":62}}},"info":{"ephemeral_id":"07c894b6-6a13-47ef-a2af-7e3eae818b0e","uptime":{"ms":1800040}},"memstats":{"gc_next":162984672,"memory_alloc":103258432,"memory_total":49746718000}},"filebeat":{"events":{"added":37,"done":37},"harvester":{"open_files":1,"running":1}},"libbeat":{"config":{"module":{"running":0}},"output":{"events":{"acked":37,"batches":4,"total":37}},"outputs":{"kafka":{"bytes_read":1348,"bytes_write":16129}},"pipeline":{"clients":2,"events":{"active":0,"published":37,"total":37},"queue":{"acked":37}}},"registrar":{"states":{"current":1,"update":37},"writes":{"success":4,"total":4}},"system":{"load":{"1":10.85,"15":48.14,"5":48.87,"norm":{"1":2.7125,"15":12.035,"5":12.2175}}}}}}

I assume it's a continuation of this discussion? Filebeat OOM

In the old issue the gc limit was at about 13.6GB, but the metrics here say the GC limit is at ~162MB.

Is filebeat restarted between the two log metrics? The gc_next value didn't really change much.

Can you post the complete oom killer log (also check /var/log/dmesg). Should start with <name> invoked oom-killer, contain some stats, a long table and finally have a line like Killed process <pid> with some extra stats.

If I read the logs correctly, then the value of 4002812 is total_vm in 4KB (which can be quite big, as go runtime over-reserves virtual addressed, without yet allocating physical pages), and 3641509 is the rss in 4KB. The later value does not match the metrics as reported by filebeat, but then the timestamps do not add up.

For how long was filebeat running before it was killed?

Hi @steffens

#1 Is it a continuation of the last thread? Not really, this is a separate machine, separate environment and I did upgrade from 6.2.4 to 6.4.2.

#2 Just to be sure, do you mean /var/log/messages as /var/log/dmesg has driver info? Anyways I found the lines you requested:

#3 The message filebeat invoked oom-killer appears 62 times at about 1 hour intervals.

#4 The metrics where grabbed after I restarted as the machine was unresponsive, so I had to stop filebeat. It's just to show that it's not processing lots of files, basically 1.

That's loads of RSS memory being used.

Some questions:

  1. Do you use autodiscovery?
  2. Do you use config reloading?
  3. How fast does your log rotate?
  4. Do you use network shares or is the disk local?
  5. Have you configured multiline?
  6. Does the file have very very long lines?

Hi, filebeat.yml below.... But to answer your questions...

  1. Do you use autodiscovery? No
  2. Do you use config reloading? No
  3. How fast does your log rotate? Looks like daily.
  4. Do you use network shares or is the disk local? VM running openstack. The disk is block storage, but I guess it's cached localy to the compute?
  5. Have you configured multiline? No
  6. Does the file have very very long lines? Don't believe so.
> max_procs: 1
> filebeat.prospectors:
> - type: log
>   paths:
>     - /var/lib/mesos/slave/slaves/*/frameworks/*/executors/*/runs/latest/stdout*
>     - /var/lib/mesos/slave/slaves/*/frameworks/*/executors/*/runs/latest/stderr*
>   exclude_files: ["stdout.logrotate.state", "stdout.logrotate.conf", "stderr.logrotate.state", "stderr.logrotate.conf"]
>   fields:
>     source_type: "framework"
>   fields_under_root: true
>   tail_files: false
> 
> - type: log
>   paths:
>     - /var/log/mesos/*.log
>     - /var/log/dcos/dcos.log
>   fields:
>     source_type: "dcos"
>   fields_under_root: true
>   tail_files: false
> #xxxxxx.l4lb.thisdcos.directory is a load balanced VIP.
> output.kafka:
>   hosts: ["xxxxxx.l4lb.thisdcos.directory:9092"]
> 
>   version: 0.11.0.0
> 
>   topic: "app-logs"
>   partition.round_robin:
>     reachable_only: true
> 
>   required_acks: -1
>   max_message_bytes: 2000000

Hmm... your config looks very simple. Given your responses and configs there is nothing special that potentially links to some memory leak we've seen in the past.

You configured max_message_bytes: 2000000. The memory queue in filebeat is 4096 events by default (queue.mem.events setting). The log input even defaults to 10MB max_bytes. per line. When sending to kafka, events are JSON encoded before forwarding the events to the kafka client. In most extreme case max_message_bytes * queue.mem.events = 8GB. Given that filebeat keeps the original unencoded event, this can indeed very much exceed 16GB.

Do you have x-pack monitoring enabled? I'd like to have a look at the queue and pipeline, and memory statistics before filebeat is restarted.

I wonder if these settings make a difference:

filebeat.prospectors:
- type:log
  ...
  max_bytes: 1000000

- type: log
  ...
  max_bytes: 1000000

queue.mem.events: 512

This limits raw bytes per line read to ~1MB + 512 events in the queue -> max ~512MB raw data -> with encoding ~1GB max memory usage.

I noticed you have set reachable_only: true in the kafka output. Why? Do you have frequent network instabilities between filebeat and one or another kafka broker? The reachable_only: true setting is only active if the partition is inactive. If the partition is active within the kafka cluster state, but the broker is not reachable, then filebeat might still block.

Hi, I put 2000000, but I can go back to 1000000 I don't think any my messages are that big.

As for the reachable_only: true, I will go back to false also.

For monitoring? I'm on standard license is that ok?

Monitoring is part of the basic license. You can use it for free (default downloads ship with basic license available out of the box).

Can you change queue.mem.events: 512 also? So we can see how this affects memory.

Ok. Enabling monitoring also...

Hi, monitoring is enabled and below is the latest config for those nodes. What do I look for in monitoring?

queue.mem.events: 512
queue.mem.flush.min_events: 256
max_procs: 1
filebeat.prospectors:
- type: log
  paths:
    - /var/lib/mesos/slave/slaves/*/frameworks/*/executors/*/runs/latest/stdout*
    - /var/lib/mesos/slave/slaves/*/frameworks/*/executors/*/runs/latest/stderr*
  exclude_files: ["stdout.logrotate.state", "stdout.logrotate.conf", "stderr.logrotate.state", "stderr.logrotate.conf"]
  fields:
    source_type: "framework"
  fields_under_root: true
  tail_files: false

- type: log
  paths:
    - /var/log/mesos/*.log
    - /var/log/dcos/dcos.log
  fields:
    source_type: "dcos"
  fields_under_root: true
  tail_files: false

output.kafka:
  hosts: ["xxxxxx"]

  version: 0.11.0.0

  topic: "app-logs"
  partition.round_robin:
    reachable_only: false

  required_acks: -1
  max_message_bytes: 1000000

xpack.monitoring:
  enabled: true
  elasticsearch:
    hosts: ["xxxxxx"]

Ok here is something interesting....

CLUSTER 1(THE CLUSTER IN THIS THREAD) with the specified settings as above:

CLUSTER 2 (THE CLUSTER FROM THE OTHER/ORIGINAL THREAD) with the below updated settings:
So only difference is the queue.mem.events and not all nodes behave the same, plus not like there's any huge load...

filebeat.prospectors:
- type: log
  paths:
    - /var/lib/mesos/slave/slaves/*/frameworks/*/executors/*/runs/latest/stdout*
    - /var/lib/mesos/slave/slaves/*/frameworks/*/executors/*/runs/latest/stderr*
  exclude_files: ["stdout.logrotate.state", "stdout.logrotate.conf", "stderr.logrotate.state", "stderr.logrotate.conf"]
  fields:
    source_type: "framework"
  fields_under_root: true
  tail_files: false

- type: log
  paths:
    - /var/log/mesos/*.log
    - /var/log/dcos/dcos.log
  fields:
    source_type: "dcos"
  fields_under_root: true
  tail_files: false

output.kafka:
  hosts: ["xxxxxx"]

  version: 0.11.0.0

  topic: "app-logs"
  partition.round_robin:
    reachable_only:  false

  required_acks: -1
  max_message_bytes: 1000000

xpack.monitoring:
  enabled: true
  elasticsearch:
    hosts: ["xxxxxx"]

I wonder if there is a link between kafka throughput, internal queue size and memory usage. When using monitoring a new index named .monitoring-beats-<data> or so is generated. This index contains the raw documents with a many more metrics, as they are normally shown in the log file. One can create an index pattern and use discover or build dashbaords to check out some additional metrics.

For memory usage the metrics "memstats.gc_next", and "memstats.rss" are interesting. These are normally displayed in the UI.

The output event rate is also shown in the UI. The metric is the derivative of outputs.events.acked (and others).

The current queue size can be seen by pipeline.events.active (the UI only shows derivative on published, acked, and total). There should also be some retry and failure metrics (which we show by rate in UI, but not total values).

My assumption is that the queue fills up when memory usage becomes very big, maybe caused by very low throughput (about 0). In the screenshots we see 2 instances with memory usage >10GB, but interestingly these two instances have the lowest throughput.

Hi, I'm afraid I cannot turn on filebeat for those two 10GB machines right now, they become unresponsive. But here is last 24 hours for a few machines...

CLUSTER 1:

"Normal Behaviour"

Spike:

CLUSTER 2:

"Normal Behaviour"

Spike:

Spike:

And one more over the weekend...

CLUSTER 2. Different machine OOMed this time.

Have you checked filebeat logs for kafka related errors or status updates?

Not sure if this is related to kafka(network) or the writing application creating a sudden burst of events.

When the kafka client sees IO errors, it tries to reconnect with very short timeouts. But short bursts of events will also increase amount of work. The sudden spike in CPU utilisation next to spikes in queue throughput and increased memory could indicate either.

Can you create an index pattern for .monitoring-beats-* and search for a metric ending with pipeline.events.active? This gets us the current queue fill state when the metrics have been created. A simple line graph will give us an idea about the current queue fill state.

If possible, I would also be interested in a memory profile of an instance that acts normal vs. memory spikes. Starting filebeat with -httpprof localhost:6060 (I bind the socket to localhost only, no remote accesses), filebeat exposes a profiling endpoint. You should be able to collect a memory profile via curl http://localhost:6060/debug/pprof/heap > profile.txt.

So on cluster 2 here is one of the nodes for last 7 days.

03%20AM

Here is what happened when I ran the command and in Kibana it was 27GB usage. Getting the profile file also for you...

master-0001 /u/s/f/bin ❯❯❯ free -m

              total        used        free      shared  buff/cache   available
Mem:          32012        2063       27819        1152        2129       28396
Swap:          2047        1064         983

xxxxxx-master-0001 /u/s/f/bin ❯❯❯ sudo ./filebeat -c /etc/filebeat/filebeat.yml -httpprof localhost:6060

fatal error: runtime: out of memory

runtime stack:
runtime.throw(0x15cdb51, 0x16)
	/usr/local/go/src/runtime/panic.go:616 +0x81
runtime.sysMap(0xcaa6570000, 0x1b6600000, 0x1f68300, 0x1f81658)
	/usr/local/go/src/runtime/mem_linux.go:216 +0x20a
runtime.(*mheap).sysAlloc(0x1f67b80, 0x1b6600000, 0x0)
	/usr/local/go/src/runtime/malloc.go:470 +0xd4
runtime.(*mheap).grow(0x1f67b80, 0xdb2fe, 0x0)
	/usr/local/go/src/runtime/mheap.go:907 +0x60
runtime.(*mheap).allocSpanLocked(0x1f67b80, 0xdb2fe, 0x1f81668, 0x7ffd037b6ba0)
	/usr/local/go/src/runtime/mheap.go:820 +0x301
runtime.(*mheap).alloc_m(0x1f67b80, 0xdb2fe, 0x990101, 0xc41c02cbff)
	/usr/local/go/src/runtime/mheap.go:686 +0x118
runtime.(*mheap).alloc.func1()
	/usr/local/go/src/runtime/mheap.go:753 +0x4d
runtime.(*mheap).alloc(0x1f67b80, 0xdb2fe, 0x7ffd03000101, 0x99b06c)
	/usr/local/go/src/runtime/mheap.go:752 +0x8a
runtime.largeAlloc(0x1b65fc000, 0x100, 0xc4204bc770)
	/usr/local/go/src/runtime/malloc.go:826 +0x94
runtime.mallocgc.func1()
	/usr/local/go/src/runtime/malloc.go:721 +0x46
runtime.systemstack(0x0)
	/usr/local/go/src/runtime/asm_amd64.s:409 +0x79
runtime.mstart()
	/usr/local/go/src/runtime/proc.go:1175

goroutine 69 [running]:
runtime.systemstack_switch()
	/usr/local/go/src/runtime/asm_amd64.s:363 fp=0xc4204bc680 sp=0xc4204bc678 pc=0x9ded00
runtime.mallocgc(0x1b65fc000, 0x0, 0x4000, 0x4000)
	/usr/local/go/src/runtime/malloc.go:720 +0x8a2 fp=0xc4204bc720 sp=0xc4204bc680 pc=0x997642
runtime.growslice(0x13ea120, 0xc947a3e000, 0x15eb30000, 0x15eb30000, 0x15eb34000, 0x3232cae0, 0x171e7ac416, 0xc4204bc850)
	/usr/local/go/src/runtime/slice.go:172 +0x21d fp=0xc4204bc788 sp=0xc4204bc720 pc=0x9c921d
github.com/elastic/beats/libbeat/common/streambuf.(*Buffer).doAppend(0xc4201514a0, 0xc49fa68000, 0x4000, 0x4000, 0x4001, 0xffffffffffffffff, 0x1, 0xc49fa68000)
	/go/src/github.com/elastic/beats/libbeat/common/streambuf/streambuf.go:160 +0x3fb fp=0xc4204bc810 sp=0xc4204bc788 pc=0xe187cb
github.com/elastic/beats/libbeat/common/streambuf.(*Buffer).Append(0xc4201514a0, 0xc49fa68000, 0x4000, 0x4000, 0x4000, 0x0)
	/go/src/github.com/elastic/beats/libbeat/common/streambuf/streambuf.go:175 +0x57 fp=0xc4204bc860 sp=0xc4204bc810 pc=0xe18927
github.com/elastic/beats/filebeat/reader/line.(*Reader).advance(0xc4201ca5b0, 0xc420166380, 0xc420444800)
	/go/src/github.com/elastic/beats/filebeat/reader/line/line.go:129 +0x1a1 fp=0xc4204bc8f0 sp=0xc4204bc860 pc=0x12e7f81
github.com/elastic/beats/filebeat/reader/line.(*Reader).Next(0xc4201ca5b0, 0x1c52d38, 0x40, 0xfb, 0x0, 0x0, 0x0)
	/go/src/github.com/elastic/beats/filebeat/reader/line/line.go:72 +0x2f fp=0xc4204bc948 sp=0xc4204bc8f0 pc=0x12e7b3f
github.com/elastic/beats/filebeat/reader/encode.Reader.Next(0xc4201ca5b0, 0x0, 0x0, 0x0, 0x0, 0x0, 0x0, 0x0, 0x0, 0x0, ...)
	/go/src/github.com/elastic/beats/filebeat/reader/encode/encode.go:49 +0x63 fp=0xc4204bca00 sp=0xc4204bc948 pc=0x12e8703
github.com/elastic/beats/filebeat/reader/strip_newline.(*StripNewline).Next(0xc420346200, 0x0, 0x0, 0x0, 0x0, 0x0, 0x0, 0x0, 0x0, 0x0, ...)
	/go/src/github.com/elastic/beats/filebeat/reader/strip_newline/strip_newline.go:37 +0x8b fp=0xc4204bcae8 sp=0xc4204bca00 pc=0x12e8d1b
github.com/elastic/beats/filebeat/reader/limit.(*Reader).Next(0xc420167d00, 0x0, 0x0, 0x0, 0x0, 0x0, 0x0, 0x0, 0x0, 0x0, ...)
	/go/src/github.com/elastic/beats/filebeat/reader/limit/limit.go:38 +0x8b fp=0xc4204bcbd0 sp=0xc4204bcae8 pc=0x12e8a5b
github.com/elastic/beats/filebeat/input/log.(*Harvester).Run(0xc420212500, 0x0, 0x0)
	/go/src/github.com/elastic/beats/filebeat/input/log/harvester.go:260 +0x331 fp=0xc4204bcf80 sp=0xc4204bcbd0 pc=0x12ea5a1
github.com/elastic/beats/filebeat/harvester.(*Registry).Start.func1(0xc4202e3280, 0x1694140, 0xc420212500)
	/go/src/github.com/elastic/beats/filebeat/harvester/registry.go:96 +0x73 fp=0xc4204bcfc8 sp=0xc4204bcf80 pc=0x12c5063
runtime.goexit()
	/usr/local/go/src/runtime/asm_amd64.s:2361 +0x1 fp=0xc4204bcfd0 sp=0xc4204bcfc8 pc=0x9e1891
created by github.com/elastic/beats/filebeat/harvester.(*Registry).Start
	/go/src/github.com/elastic/beats/filebeat/harvester/registry.go:90 +0x12f ...

@steffens I messaged you privately the files...

Hello @javadevmtl @steffens and myself took a look at your heap profile, and from what we see there is a lot of memory used in the read buffer, this is really unusual with the nature of reading that Filebeat does.

We usually see this kind of behavior with endless lines in the logs, when filebeat cannot detect a new line, but it doesn't seem to be the case with your setup.

We have also seen this behavior with network volume (NFS or ZFS, etc.), what happens is there is a network hiccup and when we read the content of the file we receive 0s instead of data, and this can fill the buffer really fast and could cause an OOM.

Can you give us a bit more details about the hardware/setup, are theses logs read from a network volume?

It's a VM running on Openstack and the volume is backed by Cinder (It's a single volume that runs the OS also). But you would think the file is cached local to the compute node and then it synced to the block storage?