Hi,
I'm using this ELK stack:
It all works perfectly with default dashboards if I send logs from filebeat and metricbeat directly to elastic.
filebeat -> elastic -> kibana
metricbeat -> elastic -> kibana
now I want also custom logs sending from filebeat so I set up:
filebeat -> logstash -> elastic -> kibana
I also changed metricbeat to send via logstash
metricbeat -> logstash -> elastic -> kibana
I defined pipeline:
input {
        beats {
            port => 5044
        }
}
output {
	elasticsearch {
		hosts => "elasticsearch:9200"
		manage_template => false
		index => "%{[@metadata][beat]}-%{[@metadata][version]}"
		document_type => "%{[@metadata][type]}"
		user => "elastic"
		password => "changeme"
	}
}
than to be able to show dashboards I imported them as described here:
https://www.elastic.co/guide/en/beats/filebeat/current/load-kibana-dashboards.html#load-dashboards-logstash
https://www.elastic.co/guide/en/beats/metricbeat/current/load-kibana-dashboards.html#load-dashboards-logstash
Now the problem which I have is that filebeat doesn't parse the input for some reason. It creates index and everything inside discover but doesn't parse it:
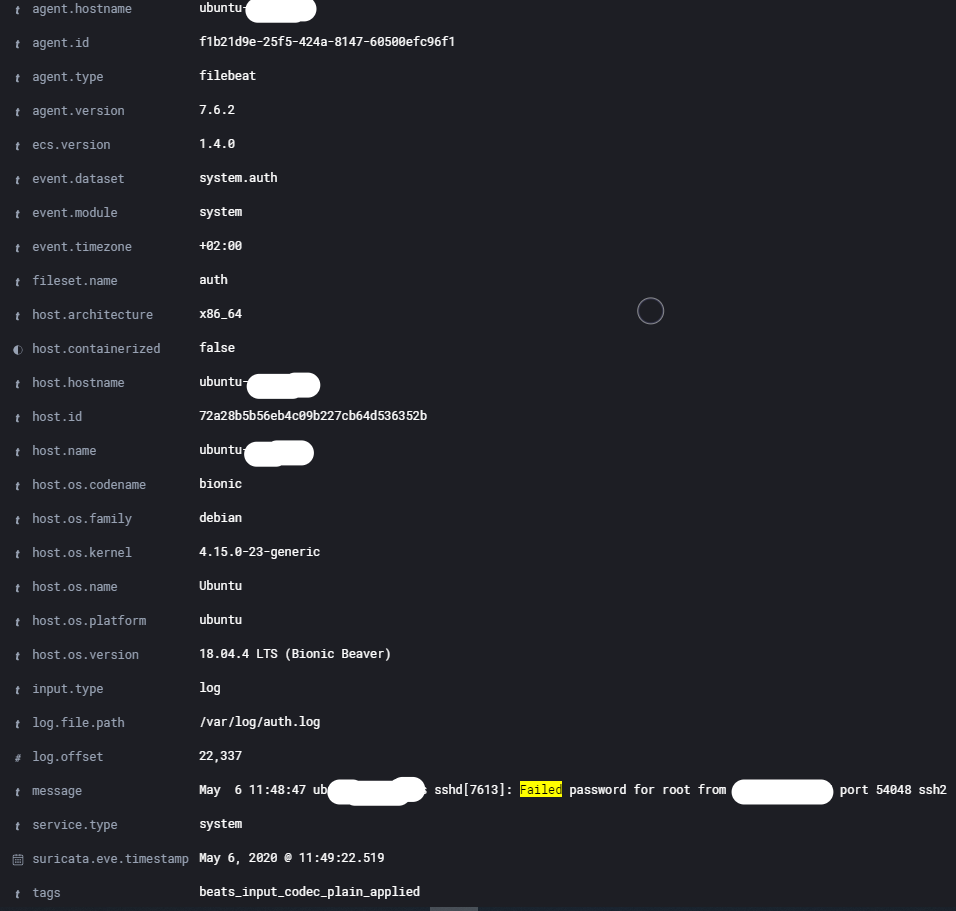
on the other hand, metricbeat works perfectly.
Any idea how to solve this filebeat problem?