Filebeat is blocked since the bulk send failure

hi experts,

My filebeat case is the filebeat is always blocked since there are some bulk send failures due to the unexpected bad format of log event in each file, then it seems filebeat is busy in trying re-send the failures to elasticsearch and leave the reset fresh files there.

I'm not sure if filebeat can not always focus on sending the "already failure bulk messages", but still can continue consume the fresh files and send the good content to es.

I usually stop the filebeat service why it's blocked, the restart it, sometimes it can consume some existing files. but this is not a good way to handler it, actually what I want is filebeat can skip send the bulk messages if re-try for N[maybe 3 ] times. and continue consume the fresh files there.

is there's any settings in the config that can helps on my problem.

thanks!

I'm not sure if filebeat will release the harvester of this kind of file if some bad format message in the file. it seems it wont skip the bulk messages and always try resend it. then it means new files have no chance to be consumed by the filebeat since there's a harvester limit on each log input type.

while checking the filebeat doc:

max_retries edit

Filebeat ignores the max_retries setting and retries indefinitely.

it means the current harvested file will not be released if there's any error in the log file. so the new file has no chance to be consumed by filebeat.
May I know is there any workaround for my situation?

What is the version of Filebeat you are using? Could you please share the debug logs of Filebeat? (./filebeat -e -d "*")

actually I almost do nothing to filebeat, but basically 3 steps can help on this issue:

  1. try stop and re-start filebeat, then the fresh files will have chance to be consumed by filebeat
  2. try set a more big harvester limit to improve this probability for the new files.
  3. actually there are several kinds of log in my configuration, and I just enable only one each time, it can help.

I'm not sure why filebeat is blocked, but the above 3 ways do make sense to help this issue.

and more debugg ingo:

my filebeat.yml is something like:

filebeat.inputs:

# Each - is an input. Most options can be set at the input level, so
# you can use different inputs for various configurations.
# Below are the input specific configurations.

- type: log

  # Change to true to enable this input configuration.
  enabled: false

  # Paths that should be crawled and fetched. Glob based paths.
  paths:
    - /home/tdni/hygon_apps/fileReader/log/*.log
    #- c:\programdata\elasticsearch\logs\*

  # Exclude lines. A list of regular expressions to match. It drops the lines that are
  # matching any regular expression from the list.
  #exclude_lines: ['^DBG']

  # Include lines. A list of regular expressions to match. It exports the lines that are
  # matching any regular expression from the list.
  include_lines: ['^EventType']
  harvester_limit: 1
  pipeline: general_log
  

- type: log

  # Change to true to enable this input configuration.
  enabled: false

  # Paths that should be crawled and fetched. Glob based paths.
  paths:
    - /extend/data_log/FT/*.log
    #- c:\programdata\elasticsearch\logs\*

  # Exclude files. A list of regular expressions to match. Filebeat drops the files that
  # are matching any regular expression from the list. By default, no files are dropped.
  #exclude_files: ['.gz$']
  scan_frequency: 1
  close_eof: true
  clean_removed: true
  harvester_limit: 2
  
  pipeline: ft-test
  
- type: log

  # Change to true to enable this input configuration.
  enabled: false

  # Paths that should be crawled and fetched. Glob based paths.
  paths:
    - /extend/data_log/SLT/*.log
    #- c:\programdata\elasticsearch\logs\*

  # Exclude files. A list of regular expressions to match. Filebeat drops the files that
  # are matching any regular expression from the list. By default, no files are dropped.
  #exclude_files: ['.gz$']
  scan_frequency: 1
  close_eof: true
  clean_removed: true
  harvester_limit: 10
  
  pipeline: slt-test

you can see I use the below 2 options to close the file harvester and remove files from register.

  1. close_eof: true
  2. clean_removed: true

In my case, I have a script to read the filebeat log to remove the log files by grep "End of file reached" event in the filebeat log.

while filebeat is blocked, then the log only shows 'bulk send failure' endlessly, but do nothing to new files. never close the existing harvester and open new file harvester since. and then all the files just keep there. in the meanwhile, the kibana filebeat monitor metric retry in pipeline shows a very stable line.

now this is a screen-shot of the filebeat monitor,
you can see nothing is send to es while filebeat is busy in re-try event, and I just stop and restart filebeat and change the configuration then it can consume some new files.

and my question is:

what if there are some message which can not be consumed by elasticsearch? filebeat just try re-send it endlessly and never release the harvester? In which situation filebeat will skip those messages and continue read the rest of file until eof reached? or filebeat just read all the message until end of file reached but those bad message just keep in the output pipeline and send failure there. Is there a situation that the output queue are all the bad messages and then the queue is blocked?

thanks!

is there's any possibility that the failed msg would be dropped [not saved in hardisk] during filebat restart? and then the it won't block the output queue since failed msg are clear?

the endless 'Failed to publish events: temporary bulk send failure' is due to the elasticsearch ingest pipeline processors failed to parse the message[using kv processors], then it seems filebeat just stops to consume all the others types of log files even they are all the fresh files. I can not enable the debug mode since it would generate a huge amount of files while during the endless failure.

basically there are 2 kinds of es ingest pipeline failure, one is the parse failure which will result in the endless send failure and cause filebeat blocked. another failure is the es index failure, which would not block the filebeat.

Harvesters are not stopped until all events are ACKed or it reaches EOF of the file it is reading and one of the close_* settings require it to stop.
So your problem is that ES does not send and ACK, because it fails to parse the events using the pipeline you have configured. Once the pipeline is able to parse events or correct error handling is added to the pipelines, the problem should go away.

Could you share your pipelines and example log messages which cannot be parsed?

thanks for you explanation, my another question is if I stop and restart the filebeat, then should all the failed parse messages would be discard by the elasticsearch/filebeat or not? why said so is my finding is the restart filebeat would help a lot to this issue. usually the filebeat monitor metric 're-try in pipeline' changes to 0 from about 35 before the restart.

this is the es error, does it means the message is an empty message?

This error means that your pipeline cannot process the events from Filebeat. Yes, one of the problems is that message is empty. If you want to ignore parsing errors I suggest you set on_failure on the pipeline. See more here: https://www.elastic.co/guide/en/elasticsearch/reference/6.4/handling-failure-in-pipelines.html

hi, thanks for your reply.
I just change the ingest pipeline configuration to catch and handle the error:

PUT _ingest/pipeline/slt-test
{
 "description": "to parse the filebeat message",
    "processors": [
      {
        "kv": {
          "field": "message",
          "field_split": ",",
          "value_split": "=",
          "on_failure" : [
            {
              "set" : {
                "field" : "FileTime",
                "value" : "2017-01-01T01:01:01.00+08:00"
              }
            }
          ]
        }
      },
      {
        "remove": {
          "field": [
            "prospector",
            "beat"
          ]
        }
      },
      {
        "date_index_name": {
          "field": "FileTime",
          "index_name_prefix": "slt-test-",
          "date_rounding": "M"
        }
      },
      {
        "fail": {
          "message": "an error message=[{{message}}], source = [{{source}}], offset = [{{offset}}], FileTime =[{{FileTime}}]"
        }
      }
    ]

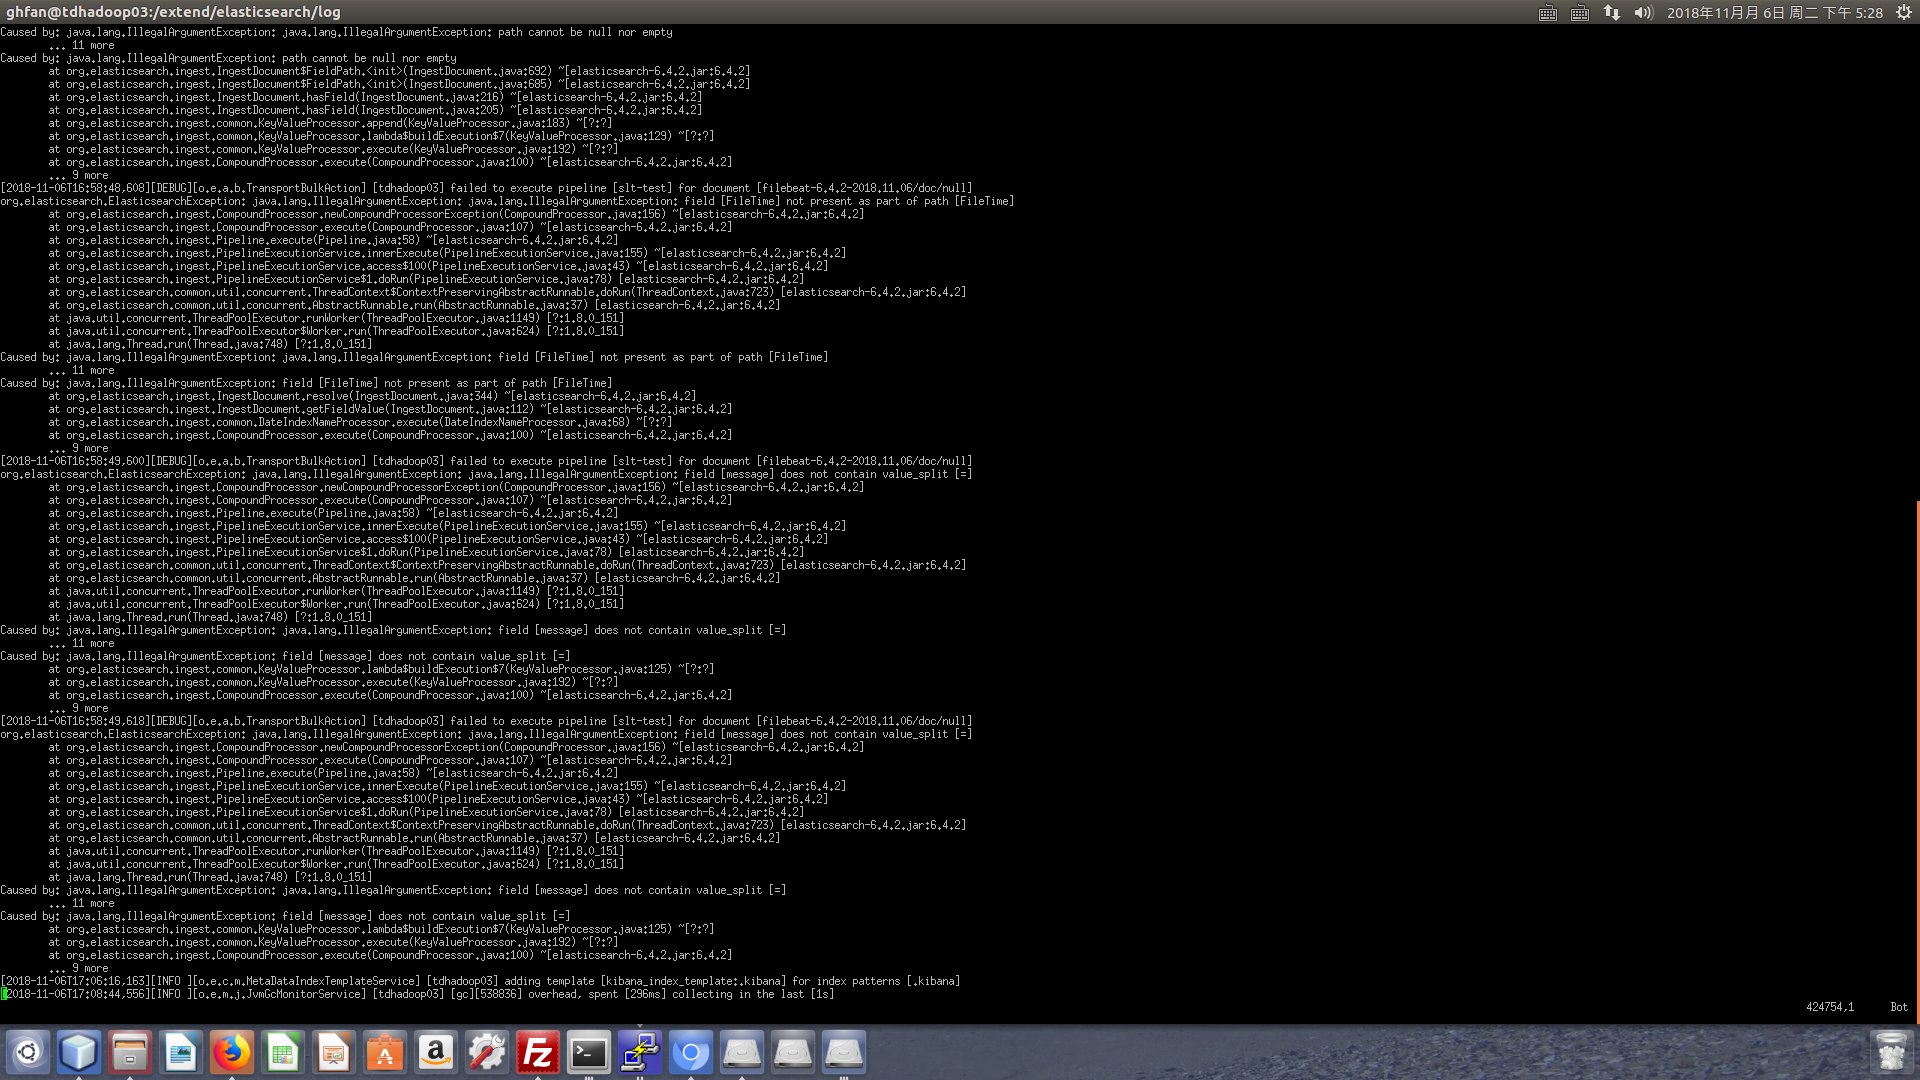
after the change, what I got from the elasticsearch log is this error, But I can not understand why this exception, actually I have ever just copy the ingest pipeline and rename to a new one, then the log file can be consumed by the elasticsearch, so I'm really confused to this exception, there are 3 processors in this pipeline and pass the first and don't know where it failed?

 [2018-11-07T12:35:14,802][DEBUG][o.e.a.b.TransportBulkAction] [tdhadoop03] failed to execute pipeline [slt-test] for document [filebeat-6.4.2-2018.11.07/doc/null]
    org.elasticsearch.ElasticsearchException: java.lang.IllegalArgumentException: org.elasticsearch.ingest.common.FailProcessorException: an error message=[LotNumber=CHARZ,Device=CHARZ,Program=MAIN,ProgramVersion=DNXDM1SLT_1.0.2,Tester=suzamdaslt088_010,TestCode=CCCCCP,Operation=CHARZ,FileTime=2018-09-06T05:07:40.00+08:00,Site=10,StartTestTime=2018-09-05T21:07:40.00+08:00,HBin=15,SBin=710028,SBinDesc=Test Fail   Power Up1 Fail,HBinDesc=Fail,BinType=0,context=FinalPowerDown,generatedTestName=FinalPowerDown,Type=Test,result=1,alarm=0,TestTime=0.111], source = [/extend/data_log/SLT/CHARZ_CHARZ_UnknownUnitID_CHARZ_CCCCCP_YD1600BBM6IAE_20180906_050740_suzamdaslt088_010_MAIN.kdf.20181031191112.log], offset = [4574], FileTime =[2018-09-06T05:07:40.00+08:00]
            at org.elasticsearch.ingest.CompoundProcessor.newCompoundProcessorException(CompoundProcessor.java:156) ~[elasticsearch-6.4.2.jar:6.4.2]
            at org.elasticsearch.ingest.CompoundProcessor.execute(CompoundProcessor.java:107) ~[elasticsearch-6.4.2.jar:6.4.2]
            at org.elasticsearch.ingest.Pipeline.execute(Pipeline.java:58) ~[elasticsearch-6.4.2.jar:6.4.2]
            at org.elasticsearch.ingest.PipelineExecutionService.innerExecute(PipelineExecutionService.java:155) ~[elasticsearch-6.4.2.jar:6.4.2]
            at org.elasticsearch.ingest.PipelineExecutionService.access$100(PipelineExecutionService.java:43) ~[elasticsearch-6.4.2.jar:6.4.2]
            at org.elasticsearch.ingest.PipelineExecutionService$1.doRun(PipelineExecutionService.java:78) [elasticsearch-6.4.2.jar:6.4.2]
            at org.elasticsearch.common.util.concurrent.ThreadContext$ContextPreservingAbstractRunnable.doRun(ThreadContext.java:723) [elasticsearch-6.4.2.jar:6.4.2]
            at org.elasticsearch.common.util.concurrent.AbstractRunnable.run(AbstractRunnable.java:37) [elasticsearch-6.4.2.jar:6.4.2]
            at java.util.concurrent.ThreadPoolExecutor.runWorker(ThreadPoolExecutor.java:1149) [?:1.8.0_151]
            at java.util.concurrent.ThreadPoolExecutor$Worker.run(ThreadPoolExecutor.java:624) [?:1.8.0_151]
            at java.lang.Thread.run(Thread.java:748) [?:1.8.0_151]
    Caused by: java.lang.IllegalArgumentException: org.elasticsearch.ingest.common.FailProcessorException: an error message=[LotNumber=CHARZ,Device=CHARZ,Program=MAIN,ProgramVersion=DNXDM1SLT_1.0.2,Tester=suzamdaslt088_010,TestCode=CCCCCP,Operation=CHARZ,FileTime=2018-09-06T05:07:40.00+08:00,Site=10,StartTestTime=2018-09-05T21:07:40.00+08:00,HBin=15,SBin=710028,SBinDesc=Test Fail   Power Up1 Fail,HBinDesc=Fail,BinType=0,context=FinalPowerDown,generatedTestName=FinalPowerDown,Type=Test,result=1,alarm=0,TestTime=0.111], source = [/extend/data_log/SLT/CHARZ_CHARZ_UnknownUnitID_CHARZ_CCCCCP_YD1600BBM6IAE_20180906_050740_suzamdaslt088_010_MAIN.kdf.20181031191112.log], offset = [4574], FileTime =[2018-09-06T05:07:40.00+08:00]
            ... 11 more
    Caused by: org.elasticsearch.ingest.common.FailProcessorException: an error message=[LotNumber=CHARZ,Device=CHARZ,Program=MAIN,ProgramVersion=DNXDM1SLT_1.0.2,Tester=suzamdaslt088_010,TestCode=CCCCCP,Operation=CHARZ,FileTime=2018-09-06T05:07:40.00+08:00,Site=10,StartTestTime=2018-09-05T21:07:40.00+08:00,HBin=15,SBin=710028,SBinDesc=Test Fail   Power Up1 Fail,HBinDesc=Fail,BinType=0,context=FinalPowerDown,generatedTestName=FinalPowerDown,Type=Test,result=1,alarm=0,TestTime=0.111], source = [/extend/data_log/SLT/CHARZ_CHARZ_UnknownUnitID_CHARZ_CCCCCP_YD1600BBM6IAE_20180906_050740_suzamdaslt088_010_MAIN.kdf.20181031191112.log], offset = [4574], FileTime =[2018-09-06T05:07:40.00+08:00]
            at org.elasticsearch.ingest.common.FailProcessor.execute(FailProcessor.java:52) ~[?:?]
            at org.elasticsearch.ingest.CompoundProcessor.execute(CompoundProcessor.java:100) ~[elasticsearch-6.4.2.jar:6.4.2]

after check the details I found this error is about filebeat, document [filebeat-6.4.2-2018.11.07/doc/null], why there's any empty filebeat monitor message, and also it was send to my slt-test-* index?
so, I think this error may be caused by filebeat but not my log file or the configuration.

[2018-11-07T12:35:14,802][DEBUG][o.e.a.b.TransportBulkAction] [tdhadoop03] failed to execute pipeline [slt-test] for document [filebeat-6.4.2-2018.11.07/doc/null]

I just remove the last processor and want to see if the exception is the split error as before.

{
        "fail": {
          "message": "an error message=[{{message}}], source = [{{source}}], offset = [{{offset}}], FileTime =[{{FileTime}}]"
        }
      }

then the blocked message is consumed by the elasticsearch, what happened?
this is the new config.

PUT _ingest/pipeline/slt-test
{
 "description": "to parse the filebeat message",
    "processors": [
      {
        "kv": {
          "field": "message",
          "field_split": ",",
          "value_split": "=",
          "on_failure" : [
            {
              "set" : {
                "field" : "FileTime",
                "value" : "2017-01-01T01:01:01.00+08:00"
              }
            }
          ]
        }
      },
      {
        "remove": {
          "field": [
            "prospector",
            "beat"
          ]
        }
      },
      {
        "date_index_name": {
          "field": "FileTime",
          "index_name_prefix": "slt-test-",
          "date_rounding": "M"
        }
      }
    ]
  
}

The processor fail you've used always raises an exception even if the pipeline can successfully parse the event. You forwarded an event which can be parsed by the pipeline, so there is no failure without the fail processor.

I suggested you use the on_failure processor. Add this to the end of your pipeline to see error messages when the parsing fails:

"on_failure" : [{
  "set" : {
    "field" : "error.message",
    "value" : "{{ _ingest.on_failure_message }}"
  }
}]

hi,
thank you again for your help!

yesterday I just update the pipeline settings, everything looks good. all the pending files are consumed by filebeat/elasticsearch, but after only one hour, the same issue happened again!

please look at the elasticsearch log, it says not FileTime, but actually FileTime is in each line of my log files. and I even add FileTime once failed the KV parse processor.

PUT _ingest/pipeline/slt-test
{
 "description": "to parse the filebeat message",
    "processors": [
      {
        "kv": {
          "field": "message",
          "field_split": ",",
          "value_split": "=",
          "on_failure" : [
            {
              "set" : {
                "field" : "FileTime",
                "value" : "2017-01-01T01:01:01.00+08:00"
              }
            }
          ]
        }
      },
      {
        "remove": {
          "field": [
            "prospector",
            "beat"
          ]
        }
      },
      {
        "date_index_name": {
          "field": "FileTime",
          "index_name_prefix": "slt-test-",
          "date_rounding": "M"
        }
      }
    ]
  
}

this is the elasticsearch fail log:

[2018-11-08T11:11:49,224][DEBUG][o.e.a.b.TransportBulkAction] [tdhadoop03] failed to execute pipeline [slt-test] for document [filebeat-6.4.2-2018.11.08/doc/null]
org.elasticsearch.ElasticsearchException: java.lang.IllegalArgumentException: java.lang.IllegalArgumentException: field [FileTime] not present as part of path [FileTime]
        at org.elasticsearch.ingest.CompoundProcessor.newCompoundProcessorException(CompoundProcessor.java:156) ~[elasticsearch-6.4.2.jar:6.4.2]
        at org.elasticsearch.ingest.CompoundProcessor.execute(CompoundProcessor.java:107) ~[elasticsearch-6.4.2.jar:6.4.2]
        at org.elasticsearch.ingest.Pipeline.execute(Pipeline.java:58) ~[elasticsearch-6.4.2.jar:6.4.2]
        at org.elasticsearch.ingest.PipelineExecutionService.innerExecute(PipelineExecutionService.java:155) ~[elasticsearch-6.4.2.jar:6.4.2]
        at org.elasticsearch.ingest.PipelineExecutionService.access$100(PipelineExecutionService.java:43) ~[elasticsearch-6.4.2.jar:6.4.2]
        at org.elasticsearch.ingest.PipelineExecutionService$1.doRun(PipelineExecutionService.java:78) [elasticsearch-6.4.2.jar:6.4.2]
        at org.elasticsearch.common.util.concurrent.ThreadContext$ContextPreservingAbstractRunnable.doRun(ThreadContext.java:723) [elasticsearch-6.4.2.jar:6.4.2]
        at org.elasticsearch.common.util.concurrent.AbstractRunnable.run(AbstractRunnable.java:37) [elasticsearch-6.4.2.jar:6.4.2]
        at java.util.concurrent.ThreadPoolExecutor.runWorker(ThreadPoolExecutor.java:1149) [?:1.8.0_151]
        at java.util.concurrent.ThreadPoolExecutor$Worker.run(ThreadPoolExecutor.java:624) [?:1.8.0_151]
        at java.lang.Thread.run(Thread.java:748) [?:1.8.0_151]
Caused by: java.lang.IllegalArgumentException: java.lang.IllegalArgumentException: field [FileTime] not present as part of path [FileTime]
        ... 11 more
Caused by: java.lang.IllegalArgumentException: field [FileTime] not present as part of path [FileTime]
        at org.elasticsearch.ingest.IngestDocument.resolve(IngestDocument.java:344) ~[elasticsearch-6.4.2.jar:6.4.2]
        at org.elasticsearch.ingest.IngestDocument.getFieldValue(IngestDocument.java:112) ~[elasticsearch-6.4.2.jar:6.4.2]
        at org.elasticsearch.ingest.common.DateIndexNameProcessor.execute(DateIndexNameProcessor.java:68) ~[?:?]
        at org.elasticsearch.ingest.CompoundProcessor.execute(CompoundProcessor.java:100) ~[elasticsearch-6.4.2.jar:6.4.2]
        ... 9 more
[2018-11-08T11:11:49,640][DEBUG][o.e.a.b.TransportBulkAction] [tdhadoop03] failed to execute pipeline [slt-test] for document [filebeat-6.4.2-2018.11.08/doc/null]
org.elasticsearch.ElasticsearchException: java.lang.IllegalArgumentException: java.lang.IllegalArgumentException: field [FileTime] not present as part of path [FileTime]
        at org.elasticsearch.ingest.CompoundProcessor.newCompoundProcessorException(CompoundProcessor.java:156) ~[elasticsearch-6.4.2.jar:6.4.2]
        at org.elasticsearch.ingest.CompoundProcessor.execute(CompoundProcessor.java:107) ~[elasticsearch-6.4.2.jar:6.4.2]
        at org.elasticsearch.ingest.Pipeline.execute(Pipeline.java:58) ~[elasticsearch-6.4.2.jar:6.4.2]
        at org.elasticsearch.ingest.PipelineExecutionService.innerExecute(PipelineExecutionService.java:155) ~[elasticsearch-6.4.2.jar:6.4.2]
        at org.elasticsearch.ingest.PipelineExecutionService.access$100(PipelineExecutionService.java:43) ~[elasticsearch-6.4.2.jar:6.4.2]
        at org.elasticsearch.ingest.PipelineExecutionService$1.doRun(PipelineExecutionService.java:78) [elasticsearch-6.4.2.jar:6.4.2]
        at org.elasticsearch.common.util.concurrent.ThreadContext$ContextPreservingAbstractRunnable.doRun(ThreadContext.java:723) [elasticsearch-6.4.2.jar:6.4.2]
        at org.elasticsearch.common.util.concurrent.AbstractRunnable.run(AbstractRunnable.java:37) [elasticsearch-6.4.2.jar:6.4.2]
        at java.util.concurrent.ThreadPoolExecutor.runWorker(ThreadPoolExecutor.java:1149) [?:1.8.0_151]
        at java.util.concurrent.ThreadPoolExecutor$Worker.run(ThreadPoolExecutor.java:624) [?:1.8.0_151]
        at java.lang.Thread.run(Thread.java:748) [?:1.8.0_151]
Caused by: java.lang.IllegalArgumentException: java.lang.IllegalArgumentException: field [FileTime] not present as part of path [FileTime]
        ... 11 more
Caused by: java.lang.IllegalArgumentException: field [FileTime] not present as part of path [FileTime]
        at org.elasticsearch.ingest.IngestDocument.resolve(IngestDocument.java:344) ~[elasticsearch-6.4.2.jar:6.4.2]
        at org.elasticsearch.ingest.IngestDocument.getFieldValue(IngestDocument.java:112) ~[elasticsearch-6.4.2.jar:6.4.2]
        at org.elasticsearch.ingest.common.DateIndexNameProcessor.execute(DateIndexNameProcessor.java:68) ~[?:?]
        at org.elasticsearch.ingest.CompoundProcessor.execute(CompoundProcessor.java:100) ~[elasticsearch-6.4.2.jar:6.4.2]
        ... 9 more

and what consumed me is I just add the your suggestion to the end of pipeline

"on_failure" : [{
  "set" : {
    "field" : "error.message",
    "value" : "{{ _ingest.on_failure_message }}"
  }
}]

and now the new pipelint is:

PUT _ingest/pipeline/slt-test
{
 "description": "to parse the filebeat message",
    "processors": [
      {
        "kv": {
          "field": "message",
          "field_split": ",",
          "value_split": "=",
          "on_failure" : [
            {
              "set" : {
                "field" : "FileTime",
                "value" : "2017-01-01T01:01:01.00+08:00"
              }
            }
          ]
        }
      },
      {
        "remove": {
          "field": [
            "message",
            "offset",
            "prospector",
            "beat"
          ]
        }
      },
      {
        "date_index_name": {
          "field": "FileTime",
          "index_name_prefix": "slt-test-",
          "date_rounding": "M"
        }
      }
    ],
    "on_failure" : [{
      "set" : {
        "field" : "error.message",
        "value" : "{{ _ingest.on_failure_message }}"
      }
    }]
  
}

then the magic thing happens, there's no any exception in the elasticsearch log,
and it this is just the log following the above exception immediately after the pipeline update.

[2018-11-08T11:11:50,264][INFO ][o.e.c.m.MetaDataCreateIndexService] [tdhadoop03] [filebeat-6.4.2-2018.11.08] creating index, cause [auto(bulk api)], templates [filebeat-6.4.2], shards [3]/[1], mappings [doc]
[2018-11-08T11:11:50,781][INFO ][o.e.c.m.MetaDataMappingService] [tdhadoop03] [filebeat-6.4.2-2018.11.08/3wOK8Rr1RMuZqYhGdwRBLw] update_mapping [doc]
[2018-11-08T11:11:50,787][INFO ][o.e.c.m.MetaDataMappingService] [tdhadoop03] [filebeat-6.4.2-2018.11.08/3wOK8Rr1RMuZqYhGdwRBLw] update_mapping [doc]
[2018-11-08T11:11:50,794][INFO ][o.e.c.m.MetaDataMappingService] [tdhadoop03] [filebeat-6.4.2-2018.11.08/3wOK8Rr1RMuZqYhGdwRBLw] update_mapping [doc]
[2018-11-08T11:11:50,802][INFO ][o.e.c.m.MetaDataMappingService] [tdhadoop03] [filebeat-6.4.2-2018.11.08/3wOK8Rr1RMuZqYhGdwRBLw] update_mapping [doc]
[2018-11-08T11:11:51,545][INFO ][o.e.c.r.a.AllocationService] [tdhadoop03] Cluster health status changed from [YELLOW] to [GREEN] (reason: [shards started [[filebeat-6.4.2-2018.11.08][1]] ...]).
[2018-11-08T11:11:51,607][INFO ][o.e.c.m.MetaDataMappingService] [tdhadoop03] [filebeat-6.4.2-2018.11.08/3wOK8Rr1RMuZqYhGdwRBLw] update_mapping [doc]
[2018-11-08T11:11:51,788][INFO ][o.e.c.m.MetaDataMappingService] [tdhadoop03] [filebeat-6.4.2-2018.11.08/3wOK8Rr1RMuZqYhGdwRBLw] update_mapping [doc]
[2018-11-08T11:11:51,845][INFO ][o.e.c.m.MetaDataMappingService] [tdhadoop03] [slt-test-2018-11-01/eYFv8yAETAqN7CgGL7PhXQ] update_mapping [doc]
[2018-11-08T11:11:52,223][INFO ][o.e.c.m.MetaDataMappingService] [tdhadoop03] [filebeat-6.4.2-2018.11.08/3wOK8Rr1RMuZqYhGdwRBLw] update_mapping [doc]
[2018-11-08T11:11:52,367][INFO ][o.e.c.m.MetaDataMappingService] [tdhadoop03] [slt-test-2018-11-01/eYFv8yAETAqN7CgGL7PhXQ] update_mapping [doc]
[2018-11-08T11:11:52,470][INFO ][o.e.c.m.MetaDataMappingService] [tdhadoop03] [filebeat-6.4.2-2018.11.08/3wOK8Rr1RMuZqYhGdwRBLw] update_mapping [doc]
[2018-11-08T11:11:53,172][INFO ][o.e.c.m.MetaDataMappingService] [tdhadoop03] [filebeat-6.4.2-2018.11.08/3wOK8Rr1RMuZqYhGdwRBLw] update_mapping [doc]
[2018-11-08T11:11:53,378][INFO ][o.e.c.m.MetaDataMappingService] [tdhadoop03] [filebeat-6.4.2-2018.11.08/3wOK8Rr1RMuZqYhGdwRBLw] update_mapping [doc]
[2018-11-08T11:11:53,566][INFO ][o.e.c.m.MetaDataMappingService] [tdhadoop03] [filebeat-6.4.2-2018.11.08/3wOK8Rr1RMuZqYhGdwRBLw] update_mapping [doc]
[2018-11-08T11:11:53,675][INFO ][o.e.c.m.MetaDataMappingService] [tdhadoop03] [slt-test-2018-11-01/eYFv8yAETAqN7CgGL7PhXQ] update_mapping [doc]
[2018-11-08T11:11:53,719][INFO ][o.e.c.m.MetaDataMappingService] [tdhadoop03] [filebeat-6.4.2-2018.11.08/3wOK8Rr1RMuZqYhGdwRBLw] update_mapping [doc]
[2018-11-08T11:11:53,932][INFO ][o.e.c.m.MetaDataMappingService] [tdhadoop03] [filebeat-6.4.2-2018.11.08/3wOK8Rr1RMuZqYhGdwRBLw] update_mapping [doc]
[2018-11-08T11:13:21,663][INFO ][o.e.c.m.MetaDataIndexTemplateService] [tdhadoop03] adding template [kibana_index_template:.kibana] for index patterns [.kibana]
[2018-11-08T11:13:22,587][INFO ][o.e.c.m.MetaDataIndexTemplateService] [tdhadoop03] adding template [kibana_index_template:.kibana] for index patterns [.kibana]
[2018-11-08T11:13:23,164][INFO ][o.e.c.m.MetaDataIndexTemplateService] [tdhadoop03] adding template [kibana_index_template:.kibana] for index patterns [.kibana]
[2018-11-08T11:13:23,879][INFO ][o.e.c.m.MetaDataIndexTemplateService] [tdhadoop03] adding template [kibana_index_template:.kibana] for index patterns [.kibana]
[2018-11-08T11:13:24,285][INFO ][o.e.c.m.MetaDataIndexTemplateService] [tdhadoop03] adding template [kibana_index_template:.kibana] for index patterns [.kibana]
[2018-11-08T11:13:24,828][INFO ][o.e.c.m.MetaDataIndexTemplateService] [tdhadoop03] adding template [kibana_index_template:.kibana] for index patterns [.kibana]
[2018-11-08T11:13:25,321][INFO ][o.e.c.m.MetaDataIndexTemplateService] [tdhadoop03] adding template [kibana_index_template:.kibana] for index patterns [.kibana]
[2018-11-08T11:13:25,769][INFO ][o.e.c.m.MetaDataIndexTemplateService] [tdhadoop03] adding template [kibana_index_template:.kibana] for index patterns [.kibana]
[2018-11-08T11:13:28,577][INFO ][o.e.c.m.MetaDataIndexTemplateService] [tdhadoop03] adding template [kibana_index_template:.kibana] for index patterns [.kibana]
[2018-11-08T11:13:28,987][INFO ][o.e.c.m.MetaDataIndexTemplateService] [tdhadoop03] adding template [kibana_index_template:.kibana] for index patterns [.kibana]
[2018-11-08T11:13:29,168][INFO ][o.e.c.m.MetaDataIndexTemplateService] [tdhadoop03] adding template [kibana_index_template:.kibana] for index patterns [.kibana]

so I'm really very very confused by this exception......

and one question is : how to log the full message and the source[log file name] in the elasticsearch while there's an exception? then I can check what happens, now what I do is actually do nothing, but it does helps and it make no any sense, right?

the magic thing in the filebat log after the pipeline changes, from bulk send failure to normal status immediately.
But I think the issue will happens again later just like before.

2018-11-08T11:11:49.623+0800    INFO    template/load.go:129    Template already exists and will not be overwritten.
2018-11-08T11:11:49.623+0800    INFO    pipeline/output.go:105  Connection to backoff(elasticsearch(http://10.72.1.237:9200)) established
2018-11-08T11:11:49.626+0800    ERROR   pipeline/output.go:121  Failed to publish events: temporary bulk send failure
2018-11-08T11:11:49.626+0800    INFO    pipeline/output.go:95   Connecting to backoff(elasticsearch(http://10.72.1.238:9200))
2018-11-08T11:11:49.628+0800    INFO    elasticsearch/client.go:712     Connected to Elasticsearch version 6.4.2
2018-11-08T11:11:49.629+0800    ERROR   pipeline/output.go:121  Failed to publish events: temporary bulk send failure
2018-11-08T11:11:49.629+0800    INFO    pipeline/output.go:95   Connecting to backoff(elasticsearch(http://10.72.1.239:9200))
2018-11-08T11:11:49.631+0800    INFO    elasticsearch/client.go:712     Connected to Elasticsearch version 6.4.2
2018-11-08T11:11:49.633+0800    INFO    template/load.go:129    Template already exists and will not be overwritten.
2018-11-08T11:11:49.633+0800    INFO    pipeline/output.go:105  Connection to backoff(elasticsearch(http://10.72.1.238:9200)) established
2018-11-08T11:11:49.636+0800    INFO    template/load.go:129    Template already exists and will not be overwritten.
2018-11-08T11:11:49.636+0800    INFO    pipeline/output.go:105  Connection to backoff(elasticsearch(http://10.72.1.239:9200)) established
2018-11-08T11:11:50.221+0800    ERROR   pipeline/output.go:121  Failed to publish events: temporary bulk send failure
2018-11-08T11:11:50.221+0800    INFO    pipeline/output.go:95   Connecting to backoff(elasticsearch(http://10.72.1.238:9200))
2018-11-08T11:11:50.223+0800    INFO    elasticsearch/client.go:712     Connected to Elasticsearch version 6.4.2
2018-11-08T11:11:50.224+0800    ERROR   pipeline/output.go:121  Failed to publish events: temporary bulk send failure
2018-11-08T11:11:50.224+0800    INFO    pipeline/output.go:95   Connecting to backoff(elasticsearch(http://10.72.1.239:9200))
2018-11-08T11:11:50.226+0800    INFO    elasticsearch/client.go:712     Connected to Elasticsearch version 6.4.2
2018-11-08T11:11:50.228+0800    INFO    template/load.go:129    Template already exists and will not be overwritten.
2018-11-08T11:11:50.228+0800    INFO    pipeline/output.go:105  Connection to backoff(elasticsearch(http://10.72.1.238:9200)) established
2018-11-08T11:11:50.231+0800    INFO    template/load.go:129    Template already exists and will not be overwritten.
2018-11-08T11:11:50.232+0800    INFO    pipeline/output.go:105  Connection to backoff(elasticsearch(http://10.72.1.239:9200)) established
2018-11-08T11:11:50.622+0800    ERROR   pipeline/output.go:121  Failed to publish events: temporary bulk send failure
2018-11-08T11:11:50.622+0800    INFO    pipeline/output.go:95   Connecting to backoff(elasticsearch(http://10.72.1.237:9200))
2018-11-08T11:11:50.624+0800    INFO    elasticsearch/client.go:712     Connected to Elasticsearch version 6.4.2
2018-11-08T11:11:50.626+0800    ERROR   pipeline/output.go:121  Failed to publish events: temporary bulk send failure
2018-11-08T11:11:50.626+0800    INFO    pipeline/output.go:95   Connecting to backoff(elasticsearch(http://10.72.1.237:9200))
2018-11-08T11:11:50.628+0800    INFO    elasticsearch/client.go:712     Connected to Elasticsearch version 6.4.2
2018-11-08T11:11:50.630+0800    INFO    template/load.go:129    Template already exists and will not be overwritten.
2018-11-08T11:11:50.630+0800    INFO    pipeline/output.go:105  Connection to backoff(elasticsearch(http://10.72.1.237:9200)) established
2018-11-08T11:11:50.636+0800    INFO    template/load.go:129    Template already exists and will not be overwritten.
2018-11-08T11:11:50.636+0800    INFO    pipeline/output.go:105  Connection to backoff(elasticsearch(http://10.72.1.237:9200)) established
2018-11-08T11:11:50.637+0800    ERROR   pipeline/output.go:121  Failed to publish events: temporary bulk send failure
2018-11-08T11:11:50.640+0800    ERROR   pipeline/output.go:121  Failed to publish events: temporary bulk send failure
2018-11-08T11:11:50.858+0800    INFO    log/harvester.go:251    Harvester started for file: /extend/data_log/SLT/HG00155B.1_6310_H800S0018072104_CESLT_ATCACP_DS2000DAGCB00_20181108_022032_suzamdaslt083_007_MAIN.kdf.20181108031004.log
2018-11-08T11:11:50.858+0800    INFO    log/harvester.go:274    End of file reached: /extend/data_log/SLT/HG00155B.1_6310_H800S0025032304_CESLT_ATCACP_DS2000DAGCB00_20181108_081544_suzamdaslt083_003_MAIN.kdf.20181108091005.log. Closing because close_eof is enabled.
2018-11-08T11:11:50.860+0800    INFO    log/harvester.go:251    Harvester started for file: /extend/data_log/SLT/HG00180.1.1_6310_H80130002021104_SLT_AXFNCP_DS2000DAGCB00_20181107_145235_suzamdaslt083_010_MAIN.kdf.20181107155001.log
2018-11-08T11:11:50.864+0800    INFO    log/harvester.go:251    Harvester started for file: /extend/data_log/SLT/ENG181103_NotFound_M77RQ0017081904_1_BWCACB_DNOPNDNOPN001_20181107_210139_suzamdaslt083_002_BUYOFF.kdf.20181107213005.log
2018-11-08T11:11:50.864+0800    INFO    log/harvester.go:274    End of file reached: /extend/data_log/SLT/HG00180.1.1_6310_H80130002021104_SLT_AXFNCP_DS2000DAGCB00_20181107_145235_suzamdaslt083_010_MAIN.kdf.20181107155001.log. Closing because close_eof is enabled.
2018-11-08T11:11:50.864+0800    INFO    log/harvester.go:274    End of file reached: /extend/data_log/SLT/HG00155B.1_6310_H800S0019021504_CESLT_ATCACP_DS2000DAGCB00_20181108_092759_suzamdaslt083_005_MAIN.kdf.20181108101003.log. Closing because close_eof is enabled.
2018-11-08T11:11:50.864+0800    INFO    log/harvester.go:251    Harvester started for file: /extend/data_log/SLT/HG00180.1.1_6310_H80130024112404_SLT_AXFNCP_DS2000DAGCB00_20181107_144855_suzamdaslt083_004_MAIN.kdf.20181107155002.log
2018-11-08T11:11:50.865+0800    INFO    log/harvester.go:274    End of file reached: /extend/data_log/SLT/HG00180.1.1_6310_H80130024112404_SLT_AXFNCP_DS2000DAGCB00_20181107_144855_suzamdaslt083_004_MAIN.kdf.20181107155002.log. Closing because close_eof is enabled.
2018-11-08T11:11:50.865+0800    INFO    log/harvester.go:274    End of file reached: /extend/data_log/SLT/HG00155B.1_6310_H800S0018112204_CESLT_ATCACP_DS2000DAGCB00_20181108_012317_suzamdaslt083_008_MAIN.kdf.20181108021004.log. Closing because close_eof is enabled.

add the kibana filebeat monitor:

you can see the restart filebeat no help, and then all files consumed by filebeat after the pipeline change.

hi

so could you share how to log the failed message details in the elasticsearch by modifying the ingest pipeline if there's any exception, actually I just add one failure handler to set the FileTime value once failed the 'kv', but why es still says no field FileTime since FileTime is used as the index time-stamper.
if elastic search can log the original message, then we can know what happened.
now I just add the last processor based on your suggestion, all the pending files were consumed by filebeat/elasticsearch, however I don't think this makes any sense, so please help if you know how to log the raw message in the elastic search if there's failure.
thanks!