Filebeat sending all the lines in a log file as one single entries instead of different entries

I have installed filebeat on a server to ingest the stderr logs for tomcat instance. When I am trying to send those logs to my logstash instance its sending as one event instead of multiple events. How can I fix that?

My filebeat config looks like:

# ============================== Filebeat inputs ===============================

filebeat.inputs:

- type: log

  enabled: true

  paths:
       - E:\tomcat\instances\application\logs\application-stderr.*.log
  exclude_lines: '^[[:space:]]*$'
  multiline.type: pattern
  multiline.pattern: '((([0-9]{2}\-\b(?:Jan(?:uary)?|Feb(?:ruary)?|Mar(?:ch)?|Apr(?:il)?|May|Jun(?:e)?|Jul(?:y)?|Aug(?:ust)?|Sep(?:tember)?|Oct(?:ober)?|Nov(?:ember)?|Dec(?:ember)?)\b)-[0-9]{4}%{SPACE}+[0-9]{2}:[0-9]{2}:[0-9]{2}.[0-9]{3})|([0-9]{4}-[0-9]{2}-[0-9]{2}\s[0-9]{2}:[0-9]{2}:[0-9]{2}))'
  multiline.negate: true
  multiline.match: after

# ================================== Outputs ===================================

# Configure what output to use when sending the data collected by the beat.

# ------------------------------ Logstash Output -------------------------------
output.logstash:
  # The Logstash hosts
  hosts: ["1.2.3.4:8081"]

# ================================== Logging ===================================

# Sets log level. The default log level is info.
# Available log levels are: error, warning, info, debug
logging.level: info

My logstash config looks like:

input {
  beats {
    port => 8081
  }
}


filter {
    grok {
                        match => ["message", "%{DATESTAMP:timestamp}%{SPACE}%{GREEDYDATA:details}"]
                        match => [ "message", "\s*(?<timestamp>([0-9]{2}\-\b(?:Jan(?:uary)?|Feb(?:ruary)?|Mar(?:ch)?|Apr(?:il)?|May|Jun(?:e)?|Jul(?:y)?|Aug(?:ust)?|Sep(?:tember)?|Oct(?:ober)?|Nov(?:ember)?|Dec(?:ember)?)\b)-[0-9]{4}%{SPACE}+[0-9]{2}:[0-9]{2}:[0-9]{2}.[0-9]{3})%{SPACE}%{LOGLEVEL:logLevel}%{SPACE}%{NOTSPACE:Method}%{SPACE}%{JAVACLASS:classname}%{SPACE}(?<details>(.|\r|\n)*)" ]
                        #remove_field => [ "message" ]
                }
                date{
                        match => [ "timestamp", "dd-MMM-YYYY hh:mm:ss.SSS" ]
                        timezone => "US/Eastern"
                        target => ["@timestamp"]
                        remove_field => ["timestamp"]
                }
                mutate {
                        add_field => { "type" => "stderr" }
                        remove_field => [ "log", "ecs" ]
                }
        }

output {
        elasticsearch {
            hosts => ["127.0.0.1:9200"]
            index => "stderr"
            user => *******
            password => *********
            ssl => true
            ssl_certificate_verification => false
        }

  stdout { codec => rubydebug }
  }

This is my output in kibana:

My log file looks like:

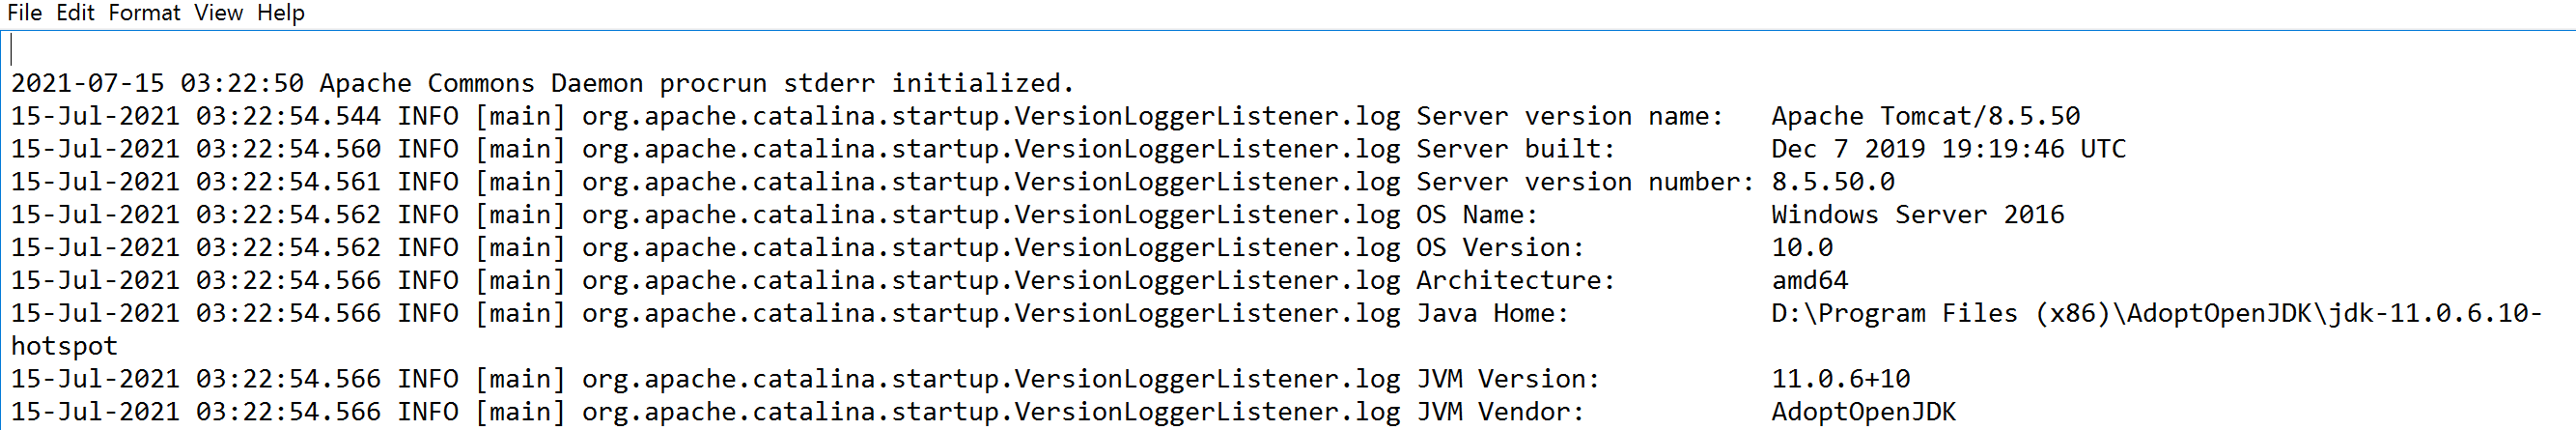
How can I separate the events?

@Patr123 ,
You written log multiline pattern. Please use below code:

- type: log

  enabled: true

  paths:
       - E:\tomcat\instances\application\logs\application-stderr.*.log
  multiline.pattern: '^[0-9]{2}-[a-z]{3}-[0-9]{4}'
  multiline.negate: true
  multiline.match: after

Tried this but the logs are not getting sent to elasticsearch now. In the stdout I still see the log lines as just one entry though.

I got this resolved. But now I am having a similar issue with a different log file.
Logstash config is:

input {
  beats {
    port => 8081
  }
}

filter {
    grok {
                        match => [ "message", "(?<timestamp>%{DATESTAMP}%{SPACE}(?:AM|am|PM|pm))%{SPACE}%{WORD:Server}%{SPACE}%{WORD:loglevel}%{SPACE}\[%{DATA:method}\]\[%{DATA:classname}\]%{SPACE}(?<details>(.|\r|\n)*)"]
                        #remove_field => [ "message" ]
                }
                date{
                        match => [ "timestamp", "yyyy-MM-dd hh:mm:ss.SSS a" ]
                        timezone => "US/Eastern"
                        target => ["@timestamp"]
                        remove_field => ["timestamp"]
                }
        }

output {
        elasticsearch {
            hosts => ["127.0.0.1:9200"]
            index => "index"
            user => username
            password => secure
            ssl => true
            ssl_certificate_verification => false
        }

  stdout { codec => rubydebug }
  }

Filebeat config is:

# ============================== Filebeat inputs ===============================

filebeat.inputs:

- type: log

  enabled: true

  paths:
       - D:\tomcat\stdout.*.log
  multiline.type: pattern
  multiline.pattern: '([0-9]{4}-[0-9]{2}-[0-9]{2}\s[0-9]{2}:[0-9]{2}:[0-9]{2}.[0-9]{3}\s(?:AM|am|PM|pm))'
  multiline.negate: true
  multiline.match: after
# ------------------------------ Logstash Output -------------------------------
output.logstash:
  # The Logstash hosts
  hosts: ["1.2.3.4:8081"]

# ================================== Logging ===================================

# Sets log level. The default log level is info.
# Available log levels are: error, warning, info, debug
logging.level: info

In the kibana all I see is:


I have few lines after this in my log file but I don't get it in kibana.

My log file looks like:

2021-07-21 03:22:54 Apache Commons Daemon procrun stdout initialized.
03:23:20,617 |-INFO in ch.qos.logback.classic.LoggerContext[default] - Could NOT find resource [logback-test.xml]
03:23:20,618 |-INFO in ch.qos.logback.classic.LoggerContext[default] - Could NOT find resource [logback.groovy]


  .   ____          _            __ _ _
 /\\ / ___'_ __ _ _(_)_ __  __ _ \ \ \ \
( ( )\___ | '_ | '_| | '_ \/ _` | \ \ \ \
 \\/  ___)| |_)| | | | | || (_| |  ) ) ) )
  '  |____| .__|_| |_|_| |_\__, | / / / /
 =========|_|==============|___/=/_/_/_/
 :: Spring Boot ::        (v2.1.8.RELEASE)

2021-07-21 03:23:41.738 AM Server1 DEBUG [localhost-startStop-1][HikariConfig] Driver class com.ibm.as400.access.AS400JDBCDriver found in Thread context class loader ParallelWebappClassLoader
  context: Application
  delegate: false
----------> Parent Classloader:
java.net.URLClassLoader@6536e911

2021-07-21 03:23:41.785 AM Server1 DEBUG [localhost-startStop-1][HikariConfig] HikariPool-1 - configuration:
2021-07-21 03:23:41.800 AM Server1 DEBUG [localhost-startStop-1][HikariConfig] allowPoolSuspension.............false
2021-07-21 03:23:41.800 AM Server1 DEBUG [localhost-startStop-1][HikariConfig] autoCommit......................true

This topic was automatically closed 28 days after the last reply. New replies are no longer allowed.