FileBeat slow - Improve performance

Hi All,

I have a bit of a problem in terms of data ingestion using FileBeat. I have multiple directories from which I wish to read data in almost near realtime. Below is the relevant snippet from my filebeat.

=========================== Filebeat prospectors =============================

filebeat.prospectors:

- type: log
  paths: ["/opt/elk/filebeat/av/*.log"]
  tags: ["av"]
  harvester_limit: 100

- type: log
  paths: ["/opt/filebeat/websense/*.log"]
  tags: ["websense"]
  harvester_limit: 1000

- type: log
  paths: ["/opt/elk/filebeat/waf/*.log"]
  tags: ["waf"]
  harvester_limit: 100

- type: log
  paths: ["/opt/elk/filebeat/ad/*.log"]
  tags: ["ad"]
  harvester_limit: 1000

There are multiple files dumped in these paths every 5 mins. The problem is that the volume of files created in each directory is not uniform. The websense and ad logs are huge in volume and FileBeat is not able to cope with the increased volume. We often see a backlog of over 2-3 hours created in these two directories. PS: Removing the harvester_limit does not make a difference to the ingestion speed.

There are ample of idle resources on the FileBeat server.

root@BEATS01:~# iostat -c
Linux 4.4.0-127-generic (SIDCBEATS01) 	08/16/2018 	_x86_64_	(4 CPU)

avg-cpu:  %user   %nice %system %iowait  %steal   %idle
           0.60    0.00    0.17    0.02    0.00   99.22

root@BEATS01:~# iostat -d
Linux 4.4.0-127-generic (SIDCBEATS01) 	08/16/2018 	_x86_64_	(4 CPU)

Device:            tps    kB_read/s    kB_wrtn/s    kB_read    kB_wrtn
loop0             0.00         0.00         0.00          8          0
fd0               0.00         0.00         0.00          4          0
sda               1.94        69.40       226.27   18111418   59047540
dm-0              3.79        69.35       226.27   18098253   59047480
dm-1              0.00         0.01         0.00       3264          0

FileBeat at no point of time crosses more than 7k-8k EPS. While this is sufficient in normal operations, but during peak hours, it does not seem to scale to 10-12k EPS.

My setup is as follows:

  1. FileBeat servers - 2 - 4 vCPU - 8 GB RAM
  2. Logstash servers - 2 - 4 vCPU - 8 GB RAM
  3. Elasticsearch - 5 - 8vCPU - 32 GB RAM

Both Logstash and Elasticsearch are not overloaded and have plenty of resources.

Elasticsearch Overview:
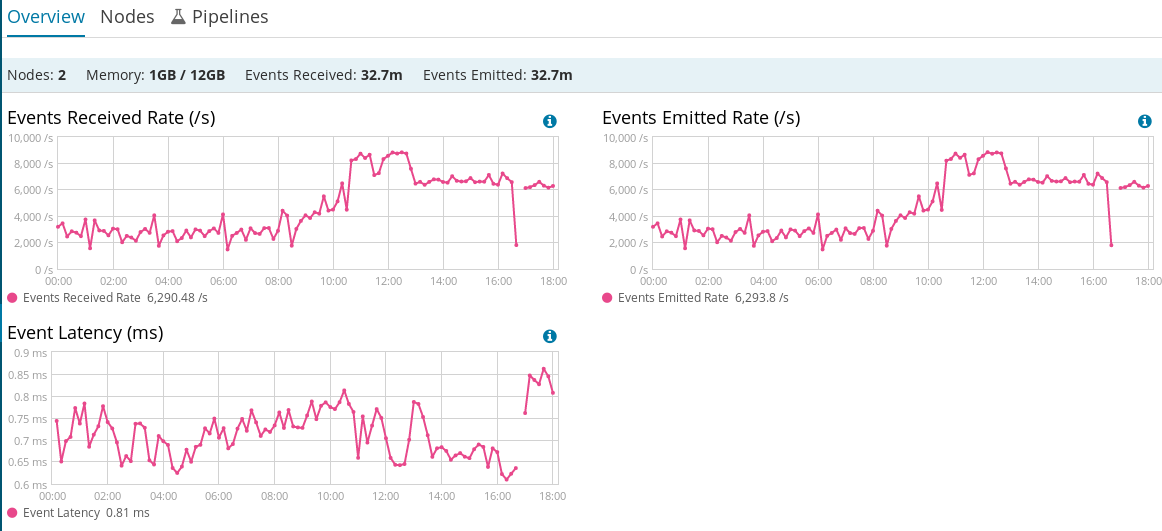
Logstash Overview:

The drops in the Events TX/RX are due to restarts we took to experiment with the batch sizes and workers. But making modifications to the batchsize and filebeat do not seem to help in improving the performace.

logstash.yml config is as follows:

## Worker and Batch settings
pipeline.workers: 8
pipeline.batch.size: 8192

filebeat.yml

#----------------------------- Logstash output --------------------------------
output.logstash:
  # The Logstash hosts
  hosts: ["10.x.x.x:5044", "10.x.x.x:5044"]
  loadbalance: true
  compression_level: 1
#  worker: 4
#  bulk_max_size: 2048

I don't see how harvester limit should affect overall ingestion rates. Harvester limit controls how many files you process in parallel.

When trying to tune ingestion, try to identify the bottleneck first. There are a few components that might create back-pressure. Filebeat is rarely the bottleneck.

I'd start testing how fast filebeat can actually process files on localhost. Have a separate filebeat test config, with separate registry file. Delete the registry between runs. Using pv, we can check filebeat throughput when using the console output:

$ ./filebeat -c test-config.yml | pv -Warl >/dev/null

in test-config.yml we configure the console output:

output.console:
  pretty: false

The pv-tool will print the throughput in number of lines == events per second to stderr.

Next try with beats + logstash.

simple logstash config for testing:

input {
  beat { ... }
}

output {
  stdout { codec => dots }
}

This config prints one dot per event. Using pv we can measure throughput:

./bin/logstash test.cfg | pv -War > /dev/null

You can measure the impact of filters in LS, by adding the filters to your test.cfg.

If event output rate in LS is large enough, you have to continue tuning LS->ES (or just ES).

In filebeat the default queue size is 4096 events and the bulk_max_size is 2048. Due to async publishing, you will have at most 4096 events in flight. If sending from one beat only, I don't think pipeline.batch.size: 8192 will be effective.

In filebeat there is a memory queue (See: queue docs), which collects the events from all harvesters. The queue is used to combine events into batches. The output draws a batch of bulk_max_size from the queue. The memory queue size setting is queue.mem.events. That is, in filebeat with filled up queues (which is quite normal due to back-pressure), you will have B = queue.mem.events / output.logstash.bulk_max_size batches. By default 2. The logstash output by default operates asynchronously, with pipelining: 2. That is, one worker can have up to 2 life batches. The queue will block and accept new events only after Logstash did ACK a batch. The total number of output workers in filebeat is given by (assuming loadbalance: true): W = output.logstash.worker * len(hosts). The total of batches the set of workers can process is given by A = W *output.logstash.pipelining. In order to keep network/outputs busy, we want queue.mem.events > A * output.logstash.bulk_max_size, with queue.mem.events being a multiple of bulk_max_size.

Setting worker > 1 is similar to configuring the same IP N times in the hosts setting. Assuming you 2 Logstash endpoints and pipelining: 2 (the default), and worker: 4 we have: W = 8 and A = 16 -> queue.mem.events > 32768. E.g. we could double the number, so to guarantee we have a batch prepare the moment we receive an ACK from logstash -> queue.mem.events: 65536.

If we tune the logstash output in filebeat in any ways without seeing reall improvements, the we did try to tune the wrong sub-system. Always measure first to identify bottlenecks.

Regarding Logstash tuning also check out: https://www.elastic.co/guide/en/logstash/current/tuning-logstash.html#tuning-logstash

The pipeline.batch.size configures the batch size forwarded to one worker. Having 8 workers, a queue size of 8192, but filebeat just publishing 4096 events max won't give you much of an improvement. A batch of 4096 events likely will be forwarded to one worker only (after some milliseconds delay controlled by pipeline.batch.delay). Bigger batches and number of workers will be more helpful if you have multiple filebeat instances.

7 Likes

Hi steffens,

First of all, thank you for such a detailed explanation. Really cleared up a few things for me.

I agree, the harvester limit has no effect on the ingestion rate. I am still running the tests that you suggested and trying to identify the bottleneck.

The first scenario, allows Filebeat to read upto 20-25k events per second.

root@BEATS02:/usr/share/filebeat/bin# ./filebeat -c /opt/filebeat/config.yml | pv -Warl > /dev/null 
[21.8k/s] [22.7k/s]

Then I tried to measure the events that were sent to Logstash without any filters using the metrics plugin. [Metrics filter plugin | Logstash Reference [8.11] | Elastic]

Here I received an event rate of around 9-9.5k per second without any filters using a single filebeat and lostash server. Both the servers are in the same segment, so ideally, network bottleneck should not exist. I can see a traffic of around 5 Mb/sec between the two servers.

The surprising fact is that even after enabling all filters, my logstash event output is still around 8-8.5k events per second. So the filters are definitely ruled out as a bottleneck.

My conf files for this test were as follows:

Logstash.yml

## Worker and Batch settings
pipeline.workers: 4
pipeline.batch.size: 4096

FileBeat

## Prospector
- type: log
  paths: ["/opt/filebeat/adcopy/*.log"]
  tags: ["ad"]

#----------------------------- Logstash output --------------------------------
output.logstash:
  # The Logstash hosts
  hosts: "10.131.54.118:5044"
  compression_level: 1
  worker: 4

I will now try to run the test with the suggestions you made here:

What outputs did you use in your Logstash config? Did you remove any Elasticsearch output (to eliminate Elasticsearch as the potential bottleneck) and use the stdout output with the dots codec as Steffen showed in his example?

Hi Christian,

Yes, I have removed the Elasticsearch output from my config.

I did initially try with the dots codec solution, but the dots were not printed on a new line by Logstash, thus the pv -Warl was not giving any output. When I tried it without the line flag, it showed a rate of kb/sec which matched with the outbound traffic on my server. Therefore, I opted for the metrics filter in Logstash, the output should be similar to what pv would give. However, here is my complete conf for reference:

input {
  beats {
    port => 5044
    ssl => false
  }
}
filter {
  if "ad" in [tags] {

    metrics {
      meter => "events"
      add_tag => "metric"
    }
#####

        dissect {
            mapping => { "message" => '%{device[ip]}||%{event[type]}||%{}||%{}||%{event[id]}||%{logmsg}' }
        }
        mutate {
            gsub => ["logmsg","\|\|$",'']
        }
        if [event][id] == "4624" {
            dissect {
        .....
        }
        else {
            drop {}
        }
        date {
            match => ["[event][timestamp]", "UNIX"]
            target => "[event][timestamp]"
        }
#####
  }
}
output {
  # only emit events with the 'metric' tag
  if "metric" in [tags] {
    stdout {
      codec => line {
        format => "rate: %{[events][rate_1m]}"
      }
    }
  }

I do have 2 FileBeat servers, however, I can configure only one server per log input as they are dumped on a NFS drive by our central log collector. Then I have written a python watcher to check the registry files for files processed and delete them from the NFS drive.

I initially felt that it was the NFS drive which was acting as the bottleneck, but I have run all these tests from my server HDDs itself and have fared no better. On doing a performance test of the NFS drive, I can see read speed of almost 500-600 MB/sec. I have a Gb/sec throughput on the NFS drive available.

So, what I understood from this in very simple terms would be that FileBeat creates a pipe containing events that it has to send, Now, all the events in this pipe are divided into cake sized small batches defined by output.logstash.bulk_max_size. Now, each worker can pick-up at max 2 such cake pieces and deliver it to Logstash with a delay defined by pipeline.batch.delay. If we wish to configure multiple workers, we have to ensure that we have enough cake slices for all of them (2 for each) available at all time. Therefore we have to set the queue.mem.events to an appropriate value.

Wouldn't it be logical to set it as high as possible, so as to ensure that FileBeat always has some events to forward?

That being said, I have set the FileBeat conf as follows:

filebeat.prospectors:

- type: log
  paths: ["/opt/filebeat/adcopy/*.log"]
  tags: ["ad"]
  include_lines: ['.*\|\|4624\|\|.*', '.*\|\|4634\|\|.*', '.*\|\|4768\|\|.*', '.*\|\|4769\|\|.*', '.*\|\|4771\|\|.*']

#================================ General =====================================

queue.mem:
  events: 65536

#----------------------------- Logstash output --------------------------------
output.logstash:
  # The Logstash hosts
  hosts: "10.x.x.x:5044"
  compression_level: 1
  worker: 4
  bulk_max_size: 4096

And the settings in Logstash.yml are:

## Worker and Batch settings
pipeline.workers: 4
pipeline.batch.size: 4096

I see an event rate of 9-9.5k/sec. There is a slight performance increase of 1k/sec after increasing the queue size in FileBeat. But that still does not explain the gap in the EPS observed locally on FileBeat and the EPS observed in Logstash. What else could I do to find out the issue here?

Issue is marked as resolved. Is this correct?

Wouldn't it be logical to set it as high as possible, so as to ensure that FileBeat always has some events to forward?

Yes and no. A higher value results in increased memory usage. Higher throughput will also be visible in higher CPU usage. Not everyone is happy with increased memory usage, assuming available throughput already matches required expectations.

The output and queue sub-systems are also separate entities. We also have an alternate spooling to disk queue, which does not impose a limit on the number of events. But yeah, would be nice if outputs could provide a hint about maximum number of events required to saturate them.

So, what I understood from this in very simple terms would be that FileBeat creates a pipe containing events that it has to send, Now, all the events in this pipe are divided into cake sized small batches defined by output.logstash.bulk_max_size .

yes

deliver it to Logstash with a delay defined by pipeline.batch.delay

This is a logstash setting. Maybe delay is the wrong term here. It's a flush timeout. If a batch is full, it should be forwarded immediately.

If we wish to configure multiple workers, we have to ensure that we have enough cake slices for all of them (2 for each) available at all time. Therefore we have to set the queue.mem.events to an appropriate value.

Yes. It's not a hard requirement, but for increasing throughput these workers should be saturated as much as possible. This is also where tuning comes in. Over-tuning by just increasing numbers can also lead to performance degradations. There are a multitude of settings and you have to find the/one optimal combination, so to fulfil some requirements on memory/CPU/network usage + throughput.

Btw. I see you set compression_level: 1. Have you tried to increase it? Personally I prefer 3, as it gives you a good middle-ground between compression-efficiency and CPU usage.
Also run tests with different worker counts and bulk_max_size, so to find some optimum.
You can also try pipelining: 3, so to increase the amount of on-flight batches, so to reduce network latencies (at the cost of increased memory usage on the server).

When measuring event rate I prefer pv over internal Logstash metrics. When measuring the rates, you have an current value and an average value. The averages actual value depends on the timeout you started measuring, the window size and the actual method used to compute the average. Plus, Logstash (running on JVM) might take some time to warm-up. Using the pv tool I always see the very last rate as well as an average value. This gives me a chance to see if results become more stable or still vary largely. When using the dots codec in Logstash use pv -War, not pv -Warl. Using -War, the tool counts every single character. Using -Warl, the tool counts lines.

I'm not too firm in logstash tuning, but see the docs. You mostly want to tune batch sizes and number of workers (as you've done already). E.g. what happens if you decrease the batch sizes in logstash, or if you increase the number of workers?
Having multiple workers in logstash, you want them to be saturated as much as possible.

Document changes (one change at a time) and see if you see performance improvements or degradations.

That was an unintended click. :smiley:

This would not be the case with me as I am currently using the server for FileBeat alone.

You were spot-on when you said this. FileBeat is definitely not the bottleneck. When i configured the queue.mem along with multiple worker in FileBeat, I could observe that the CPU utilization in Logstash would touch around 97-98%. On checking the performance of the server, we realized that Logstash is performing some very CPU intensive tasks. We ended up giving Logstash 8 cores, and the performance has doubled instantly. I can now see close to 13-14k EPS in Logstash during peak hours. This also is consuming 80-85% CPU. Will run some more tests and see if this can be fine-tuned even more.

So, after a bunch of fine-tuning I have narrowed down the config that works perfectly.

2 FileBeat servers

output.logstash:
  # The Logstash hosts
  hosts: ["10.x.x.x:5044", "10.x.x.x:5044"]
  loadbalance: true
  compression_level: 3
  worker: 4
  bulk_max_size: 4096
  pipelining: 2 #Increasing this did not seem to have any performance improvement.

queue.mem:
  events: 65536

2 Logstash servers

## Worker and Batch settings
pipeline.workers: 8
pipeline.batch.size: 8192

I observed that increasing the pipelines did not have a improvement in performance. But I guess, if in future if the logs get saturated and increasing the workers would not be feasible due to CPU limitations, in that scenario, increasing this would probably help.

Also, I added some of the drop filters configured in Logstash using regex in FileBeat (using include_lines). This also improved the performance significantly as Logstash was handling fewer drop events.

A big thanks to @steffens for all the help. Here is the new intake of logs as visible in xpack.

image

image

Thanks for the final recap. Glad you found a combination of settings that work for you.

One more question: why did you set compression_level: 3 in the end? Did you test multiple levels or more or less by my recommendation? Anyways, as filebeat+logstash run on same network infrastructure as other applications do, compression is a good idea. When testing with my logs I've seen a reduction in network bandwidth by a factor of 7.

Yes, there was a drop of almost 50% in the network traffic load after setting the compression_level: 3.

In-spite of the EPS being double of the initial value during peak intervals, my network consumption peaks at only 10-12 MBPS (should have been 20-30 MBPS). Although, it was not that much of a constraint for me, but there were no significant performance improvement even with compression_level: 1. So, I figured I might as well save some BW.

This topic was automatically closed 28 days after the last reply. New replies are no longer allowed.