any recommendation?
You didn't answer my question, so I cannot add anything.
I'm getting the same result with output { stdout { codec => rubydebug } }.
I am asking you to show me what that rubydebug codec produces.

Ok, using this log:
Job_Name: TESTj
ElapsedRenderTime: 00:00:27.8370000
FrameCount: 1
FrameList: 21
Render_Type: AfterEffects
UserSubmitter: user1
TotalTaskRenderTime: 00:00:23.2210000
JobAverageFrameRenderTime: 00d:00h:00m:23s
SubmitDate: 01/24/2020 09:56:17
CompletedDate: 01/24/2020 09:56:47
MachineSubmitted: D1-RN-XX01
JobPriority: 50
Job_ID: 5e2b2fc1dddcae24084784b7
and this pipeline:
input {
	file {
		path => "/tmpBIS/ror/elastic_env/logstash-6.7.1/testlog"
		start_position => "beginning"
 		sincedb_path => "/dev/null"
	}
}


filter {
	grok {
		break_on_match => true
		match => { "message" => [
			"Job_Name: %{WORD:Job_Name}",
			"ElapsedRenderTime: %{HAPROXYTIME:ElapsedRenderTime}",
			"FrameCount: %{NUMBER:FrameCount}",
			"FrameList: %{NUMBER:FrameList}",
			"Render_Type: %{WORD:Render_Type}",
			"UserSubmitter: %{WORD:UserSubmitter}",
			"TotalTaskRenderTime: %{HAPROXYTIME:TotalTaskRenderTime}",
			"JobAverageFrameRenderTime: %{GREEDYDATA:JobAverageFrameRenderTime}",
			"SubmitDate: %{DATESTAMP:SubmitDate}",
			"CompletedDate: %{DATESTAMP:CompletedDate}",
			"MachineSubmitted: %{GREEDYDATA:MachineSubmitted}",
			"JobPriority: %{NUMBER:JobPriority}",
			"Job_ID: %{WORD:Job_ID}" ] }
		}

	mutate {
		remove_field => [ "message","host","@version","path","@timestamp","haproxy_minute","haproxy_hour","haproxy_second" ]
	}
}
output {
	stdout {codec=> rubydebug}
}
Will result to :
{
    "FrameList" => "21"
}
{
    "JobAverageFrameRenderTime" => "00d:00h:00m:23s"
}
{
    "JobPriority" => "50"
}
{
    "FrameCount" => "1"
}
{
    "TotalTaskRenderTime" => "00:00:23.2210000"
}
{
    "MachineSubmitted" => "D1-RN-XX01"
}
{
    "Job_Name" => "TESTj"
}
{
    "Render_Type" => "AfterEffects"
}
{
    "SubmitDate" => "01/24/2020 09:56:17"
}
{
    "ElapsedRenderTime" => "00:00:27.8370000"
}
{
    "UserSubmitter" => "user1"
}
{
    "CompletedDate" => "01/24/2020 09:56:47"
}
Here’s the config file:
input {
file {
path => "\D1motion-fs\kibana_logs\render_logs\render*.log"
start_position => "beginning"
sincedb_path => "/dev/null"
}
}
filter {
grok { break_on_match => false
match => { "message" => [
"Job_Name: %{WORD:Job_Name}",
"ElapsedRenderTime: %{HAPROXYTIME:ElapsedRenderTime}",
"FrameCount: %{NUMBER:FrameCount}",
"FrameList: %{NUMBER:FrameList}",
"Render_Type: %{WORD:Render_Type}",
"UserSubmitter: %{WORD:UserSubmitter}",
"TotalTaskRenderTime: %{HAPROXYTIME:TotalTaskRenderTime}",
"JobAverageFrameRenderTime: %{GREEDYDATA:JobAverageFrameRenderTime}",
"SubmitDate: %{DATESTAMP:SubmitDate}",
"CompletedDate: %{DATESTAMP:CompletedDate}",
"MachineSubmitted: %{GREEDYDATA:MachineSubmitted}",
"JobPriority: %{NUMBER:JobPriority}",
"Job_ID: %{WORD:Job_ID}" ] }
}
mutate {
remove_field => [ "message","host","@version","path","@timestamp","haproxy_minute","haproxy_hour","haproxy_second" ]
}
}
output {
stdout { codec => rubydebug }
}
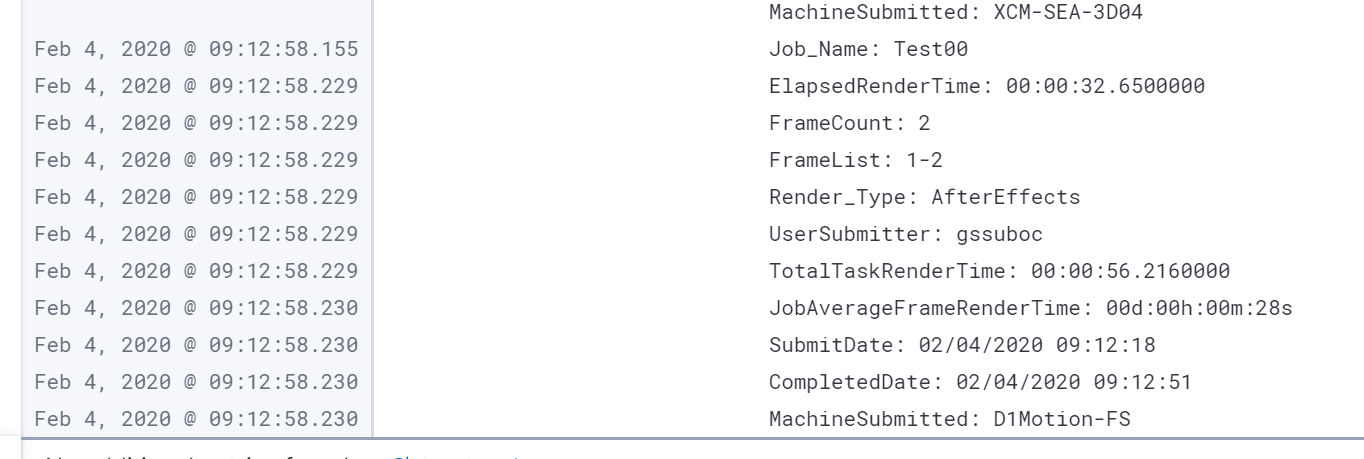
Still not separating the fieldnames from the log.
Any other recommendation? Thanks.
can you post your filebeat config? looks like your filebeat is reading your logs using multiline patterns
Here you go.
###################### Filebeat Configuration Example #########################
This file is an example configuration file highlighting only the most common
options. The filebeat.reference.yml file from the same directory contains all the
supported options with more comments. You can use it as a reference.

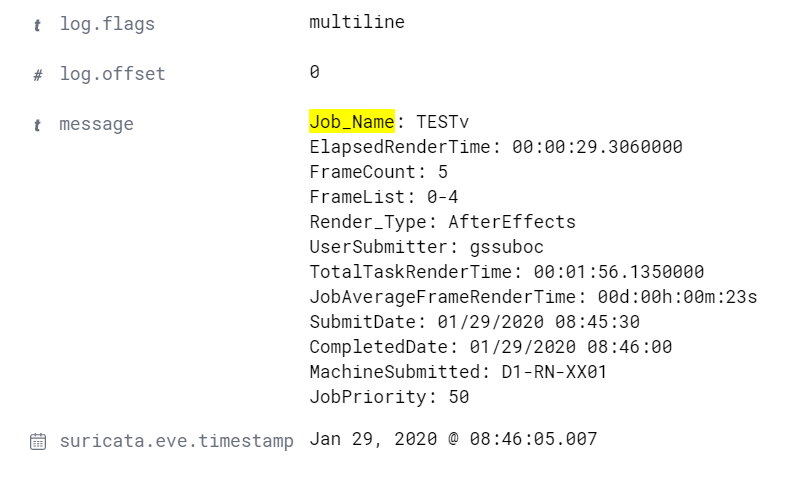
You need to show us ur filebeat file, bcoz by default, filebeat will read your file line per line unless you have enabled multiline pattern. I can see a multiline config in ur screenshot. You need to disable it. Then use my filter above. If you can’t provide us what we need then there’s no way we can help you.


Does this screenshot helps you out?
Yes, disable multiline. Its normal that it's under message field. Now, use grok filter to parse that out from message field.
grok {
		break_on_match => true
		match => { "message" => [
			"Job_Name: %{WORD:Job_Name}",
			"ElapsedRenderTime: %{HAPROXYTIME:ElapsedRenderTime}",
			"FrameCount: %{NUMBER:FrameCount}",
			"FrameList: %{NUMBER:FrameList}",
			"Render_Type: %{WORD:Render_Type}",
			"UserSubmitter: %{WORD:UserSubmitter}",
			"TotalTaskRenderTime: %{HAPROXYTIME:TotalTaskRenderTime}",
			"JobAverageFrameRenderTime: %{GREEDYDATA:JobAverageFrameRenderTime}",
			"SubmitDate: %{DATESTAMP:SubmitDate}",
			"CompletedDate: %{DATESTAMP:CompletedDate}",
			"MachineSubmitted: %{GREEDYDATA:MachineSubmitted}",
			"JobPriority: %{NUMBER:JobPriority}",
			"Job_ID: %{WORD:Job_ID}" ] }
}Yes, that’s what I have on my logstash but I can’t aggregate and visualize that field.
Is there a way to make my fields aggregatable?
Do you have a recommendation? Thanks.