I'm trying to import nginx logs into ES, i'm using this patterns
NGUSERNAME [a-zA-Z\.\@\-\+_%]+ NGUSER %{NGUSERNAME} NGINXACCESS %{IPORHOST:clientip} - %{NOTSPACE:remote_user} \[%{HTTPDATE:timestamp}\] \"(?:%{WORD:verb} %{NOTSPACE:request}(?: HTTP/%{NUMBER:httpversion})?|%{DATA:rawrequest})\" %{NUMBER:response} (?:%{NUMBER:bytes}|-) %{QS:referrer} %{QS:agent} %{NOTSPACE:http_x_forwarded_for}
all logs were successfully imported, here is a screenshot in kibana

but when I test my pattern , the result is
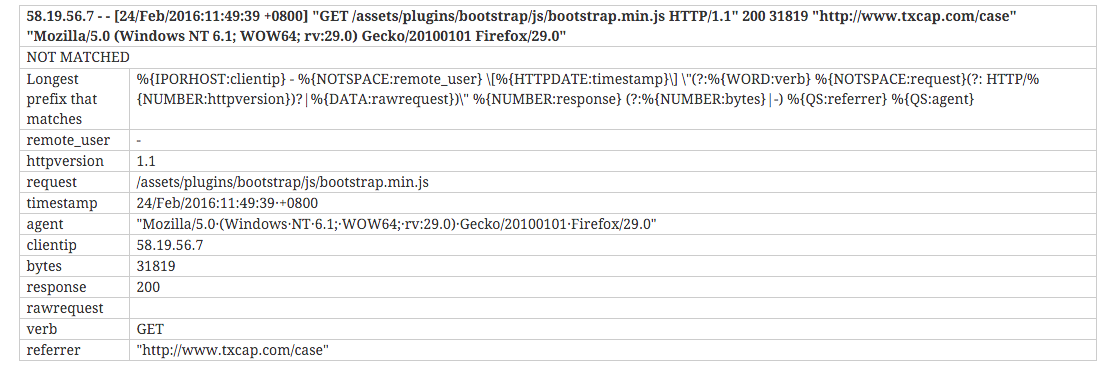
why I did not get all the fields? like clientip, agent? in kibana there is a message field, without clientip field I can not analyze the ip count
here is the grok in logstash config file, :
filter {
if [type] == "nginx-access"{
grok {
    match => { "message" => "%{NGINXACCESS}" }
}
date {
    match => [ "timestamp" , "dd/MMM/YYYY:HH:mm:ss Z" ]
}
geoip {
    source => "clientip"
}
}
}
hope someone can help me look it to it Thank you