Harvester stats always 0, no harvester logs at all but logs shipping

Do you have the logstash configurations from the other team?

Also, I think you may test this without beats to see if there is any improvement.

You have a rsyslog server receiving logs and writing to files, than you have filebeat reading those files and sending to a Logstash server, you could just configure your rsyslog server to also redirect the files to that Logstash server using TCP or UDP and listening on TCP or UDP on the other side.

But as I said, it is very hard to troubleshoot this without information about the Logstash side.

As @stephenb said, normally you would have multiple filebeats sending to a centralized Logstash, what you have is a rsyslog receiving logs from multiple sources and writing to multiple files, then just one filebeat sending to a centralized Logstash.

But, is this the issue? Maybe yes, maybe not, it is not possible to know until we have some information about how the Logstash on the other side is configured, for example, if the Logstash is using persistent queues, then the bottleneck could be the disk speed of the Logstash machine, the behaviour you shared that it lags for a couple of hours and then solve itself is consistent with some issues I had when using persistent queues.

Also, 1.3TB/day for just one Filebeat may or may not be too much, it all depends on how your log looks like and if this volume is written through the day or in burst.

I still think that the issue may be on the receiving side.

If you haven't increased the size of the internal queue within Filebeat then I would recommend making that larger to align with your configured bulk_max_size. The default queue size is 4096 and has a flush size of 2048 so you'll never get a batch larger than that unless you modify those settings. You can see that in the metrics. So your average batch size is 348160/170=2048.

I usually begin with this for queue sizing: worker x bulk_max_size * 2 = queue.mem.events.

queue.mem:
  events: 80000
  flush.min_events: 10000
  flush.timeout: 5s

output.logstash:
  hosts: ["beats-receiver.domain.com:5044"]
  ssl.enabled: true
  bulk_max_size: 0 # The size will be controlled by the size of the batch the queue dispatches.
  worker: 4

Please give those settings a try and see if you get a delta in your pv testing.

1 Like

Hi Andrew
Thank you very much for this suggestion. Here the new test config:

logging.level: info
logging.to_syslog: false
filebeat.registry.path: /tmp/registry-test
output.console:
  pretty: false

filebeat.config.modules:
  path: ${path.config}/modules.d/*.yml
  reload.enabled: false

queue.mem:
  events: 80000
  flush.min_events: 10000
  flush.timeout: 5s

filebeat.inputs:
- type: filestream
  id: log
  enabled: true
  paths:
    - /log/**/*

And here the output:

[43.8k/s] [43.8k/s]
[  48k/s] [45.9k/s]
[49.2k/s] [  47k/s]
[47.1k/s] [  47k/s]
[49.8k/s] [47.6k/s]
[45.6k/s] [47.2k/s]
[47.6k/s] [47.3k/s]
[  48k/s] [47.4k/s]
[45.6k/s] [47.2k/s]
[48.6k/s] [47.3k/s]
[46.9k/s] [47.3k/s]
[46.4k/s] [47.2k/s]
[  48k/s] [47.3k/s]
[46.3k/s] [47.2k/s]
[49.8k/s] [47.4k/s]
[50.7k/s] [47.6k/s]
[47.7k/s] [47.6k/s]
[52.6k/s] [47.9k/s]
[50.5k/s] [  48k/s]
[51.1k/s] [48.2k/s]
[47.8k/s] [48.1k/s]
[50.6k/s] [48.3k/s]
[51.8k/s] [48.4k/s]
[47.9k/s] [48.4k/s]
[51.5k/s] [48.5k/s]
[51.1k/s] [48.6k/s]
[51.4k/s] [48.7k/s]
[46.7k/s] [48.6k/s]
[31.4k/s] [  48k/s]
[47.2k/s] [47.2k/s]

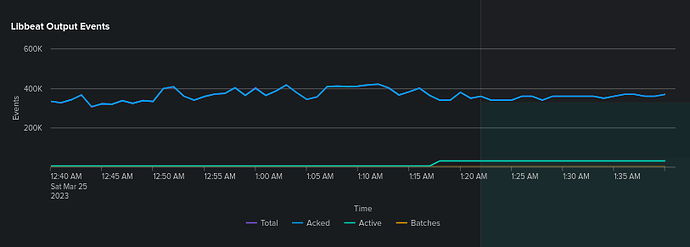
I started graphing the stats that the fb monitor spits out every 30s. Here some stats captured during that change. It made it at 1.18am


I'm still very unclear about all these counters and there appears to be no reference document explaining all these. Perhaps you can help me interpret these. Clearly, your suggestion made a noticeable difference. I have no idea if that actually affects the lag in the end but it's a good start.
Batchsize is clearly at the expected level now and go memory stuff is self-explanatory.

For libbeat output events, why does "Active" go up while "Acked" remains unchanged ?
For libbeat events 02, why is there no change here at all ?

Here the actual config that caused these graphs:

logging.level: info
logging.to_syslog: true

filebeat.config.modules:
  path: ${path.config}/modules.d/*.yml
  reload.enabled: false

queue.mem:
  events: 80000
  flush.min_events: 10000
  flush.timeout: 5s

filebeat.inputs:
- type: filestream
  id: log
  enabled: true
  paths:
    - /log/**/*
  
output.logstash:
  hosts: ["lshost:5044"]
  ssl.enabled: true
  bulk_max_size: 0
  worker: 4

processors:
  - add_fields:
      target: "tag1"
      fields:
        token: "#################"
  - add_host_metadata:
      when.not.contains.tags: forwarded
  - add_cloud_metadata: ~
  - add_docker_metadata: ~
  - add_kubernetes_metadata: ~

I am trying to get them to enable x-pack and all that next week. I will also ask for their logstash config but it seems we have something to look at yeah ?

thx

If I'm not wrong, Active are the events currently in the queue, which makes sense to go up since you increase the queue size, Acked is the number of events for which filebeat received an ack from the destination, in this case your Logstash, this means that Logstash received the event and Filebeat can remove it from the queue.

1 Like

IIUC the you observed higher throughput with the updated queue settings while using the console output and measuring with pv. I'm assuming the graphs are from the metrics when using the logstash output, is that correct?

If so it looks like there wasn't much change in the overall throughput (acked). On the Filebeat side I would verify that the process hasn't hit any CPU limits (like it's not throttled by a cpu cgroup). If not then my working assumption is that you are hitting some limits on the Logstash side (or the pipe in between). If the Logstash side is not cpu saturated then I would read over Tuning and Profiling Logstash Performance | Logstash Reference [8.6] | Elastic and try increasing the pipeline workers.

Hi Andrew
I spent some time with the team today. So their logstash is a 6 container Kubernetis setup exposed as a service. I asked him to just get the curl output for the pipeline stuff. Here it is for 1 container:

{
  "host" : "logstash-1",
  "version" : "8.5.2",
  "http_address" : "0.0.0.0:9600",
  "id" : "",
  "name" : "",
  "ephemeral_id" : "",
  "status" : "green",
  "snapshot" : false,
  "pipeline" : {
    "workers" : 16,
    "batch_size" : 125,
    "batch_delay" : 50
  },
  "monitoring" : {
    "cluster_uuid" : ""
  },
  "pipelines" : {
    "inputs" : {
      "ephemeral_id" : "",
      "hash" : "",
      "workers" : 16,
      "batch_size" : 125,
      "batch_delay" : 50,
      "config_reload_automatic" : true,
      "config_reload_interval" : 3000000000,
      "dead_letter_queue_enabled" : false
    },
    "outputs" : {
      "ephemeral_id" : "",
      "hash" : "",
      "workers" : 16,
      "batch_size" : 125,
      "batch_delay" : 50,
      "config_reload_automatic" : true,
      "config_reload_interval" : 3000000000,
      "dead_letter_queue_enabled" : false
    }
  }
}

Like I said they LB to 6 of those. They say their logstash looks ldle, like it could take more, while on my side it looks like it might be getting backlogged by logstash. However, there seems to be no way to prove one or the other. Here the latest config:

queue.mem:
  events: 160000
  flush.min_events: 10000
  flush.timeout: 5s

filebeat.inputs:
- type: filestream
  id: log
  enabled: true
  paths:
    - /log/**/*

output.logstash:
  hosts: ["beats-receiver.domain:5044"]
  ssl.enabled: true
  bulk_max_size: 0
  worker: 8
  #compression_level: 3
  pipelining: 8

Here some resulting graphs. Btw...I'm currently graphing those in splunk dashboard studio by reading out the monitor json that fb send every 30s.


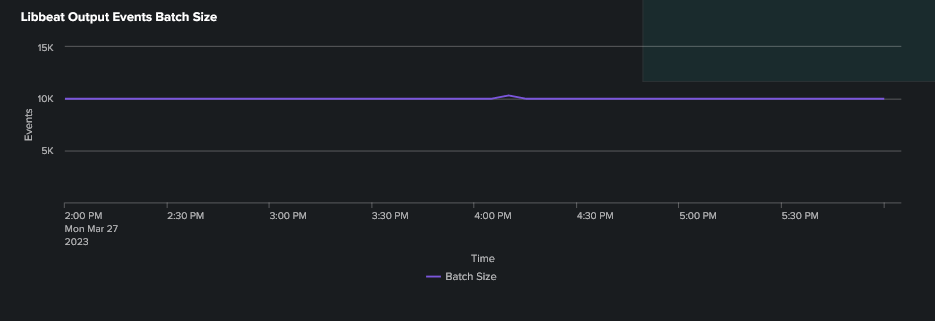
batchsize can't seem to go beyond 10k

Seems we get the internal queue up to 90000 but not the number of acks.
The point of contention is of course why filebeat is not sending more. Is it being trottled by LS or is it cause it just cannot send more.
Another question I have is this: Is each output.logstash worker supposed to open another tcp connection ? I only ever see a single connection to the target so I wanted to ask.

thx

Is there Any way you could temporarily try bypassing the Logstash Load Balancer and put all 6 logstash instances/endpoints in the filebeat output with filebeat loadbalance mode enabled? Just to Test?

So with your current setup Filebeat only sees 1 endpoint so only 4 workers total...

worker

The number of workers per configured host publishing events to Logstash. This is best used with load balancing mode enabled. Example: If you have 2 hosts and 3 workers, in total 6 workers are started (3 for each host).

loadbalance

If set to true and multiple Logstash hosts are configured, the output plugin load balances published events onto all Logstash hosts. If set to false, the output plugin sends all events to only one host (determined at random) and will switch to another host if the selected one becomes unresponsive. The default value is false.

Perhaps if you can not bypass the LoadBalancer ... Perhaps Add more logstash loadbalancer DNS endpoints give you more "Loadbalanced" logstash endpoints you can point filebeat to...

I suspect Filebeat is making 1 connection only... and it is "sticky/long runner" so many of the logstash may not be getting little / any requests. Is the logstash loadbalancer is only round-robbining Connections (therefore only connected to a single logstash) or is it round-robinning each batch ... I suspect not.

Just some thoughts...

This is the default value of batch_size, it seems to be pretty low to the rate of events you have.

The default value is pretty conservative, in production I normally double or quadruple this and for some high rate event sources I have the batch size between 1k and 3k.

How are they sending the data from Logstash to Splunk? Are they using the Http Event Collector?

I would increase the batch size, at least double it to 250 and see if anything changes.

Also, is the Logstash pipeline using persistent queue or not?

1 Like

Ok, so this gave me an idea. I cannot point to the pods directly and this is not something they could easily do BUT I figured there should be a naughty way around that by tricking filebeat into thinking that there are 6 endpoints. Here is what I did.
I created 6 cnames, all pointing back to the same LS Endpoint and then pointed filebeat to those with loadbalancing on and 6 workers. Oh my - what a difference !! I am now sending 6 times as much to them. The results are overwhelmingly clear.
Here some graphs showing the change:
image
image

These graphs are obvious but can I ask about this next one pls:
image

Given the fact that "Events Active" here has only gone down a little, does that not mean that I am still buffering a lot of events and that I could easily send more to LS if they can take it ?

Another positive change is that now I see a consistent 36 tcp connections. I presume it's "workers x endpoints" yeah ? That would make sense.

We are already seeing a massive improvement in terms of lag and we'll watch it for 12h. I am wondering though if I should not also play with the "pipelining" setting on top of that ? Either way I can see now that I can add as many fake endpoints as I want and it should pump more stuff to them until they fall over :slight_smile:

However, I still see 10000s of these messages that nobody can seem to interpret.
This looks unhealthy to me and we still don't know what #011 is referring to.

2023-03-28T23:38:02.820069+00:00 syslog-c01n01 filebeat[22734]: 2023-03-28T23:38:02.820Z INFO [input.filestream] map[file.line:321 file.name:filestream/input.go] Reader was closed. Closing.#011{"ecs.version": "1.6.0"}
2023-03-28T23:38:10.317386+00:00 syslog-c01n01 filebeat[22734]: 2023-03-28T23:38:10.317Z INFO [input.filestream] map[file.line:321 file.name:filestream/input.go] Reader was closed. Closing.#011{"ecs.version": "1.6.0"}
2023-03-28T23:38:10.317429+00:00 syslog-c01n01 filebeat[22734]: 2023-03-28T23:38:10.317Z INFO [input.filestream] map[file.line:321 file.name:filestream/input.go] Reader was closed. Closing.#011{"ecs.version": "1.6.0"}
2023-03-28T23:38:12.106868+00:00 syslog-c01n01 filebeat[22734]: 2023-03-28T23:38:12.106Z INFO [input.filestream] map[file.line:321 file.name:filestream/input.go] Reader was closed. Closing.#011{"ecs.version": "1.6.0"}
2023-03-28T23:38:12.482933+00:00 syslog-c01n01 filebeat[22734]: 2023-03-28T23:38:12.482Z INFO [input.filestream] map[file.line:321 file.name:filestream/input.go] Reader was closed. Closing.#011{"ecs.version": "1.6.0"}
2023-03-28T23:38:15.632184+00:00 syslog-c01n01 filebeat[22734]: 2023-03-28T23:38:15.632Z INFO [input.filestream] map[file.line:321 file.name:filestream/input.go] Reader was closed. Closing.#011{"ecs.version": "1.6.0"}
2023-03-28T23:38:15.657001+00:00 syslog-c01n01 filebeat[22734]: 2023-03-28T23:38:15.656Z INFO [input.filestream] map[file.line:321 file.name:filestream/input.go] Reader was closed. Closing.#011{"ecs.version": "1.6.0"}
2023-03-28T23:38:16.094649+00:00 syslog-c01n01 filebeat[22734]: 2023-03-28T23:38:16.094Z INFO [input.filestream] map[file.line:321 file.name:filestream/input.go] Reader was closed. Closing.#011{"ecs.version": "1.6.0"}
2023-03-28T23:38:21.919917+00:00 syslog-c01n01 filebeat[22734]: 2023-03-28T23:38:21.919Z INFO [input.filestream] map[file.line:321 file.name:filestream/input.go] Reader was closed. Closing.#011{"ecs.version": "1.6.0"}
2023-03-28T23:38:21.948991+00:00 syslog-c01n01 filebeat[22734]: 2023-03-28T23:38:21.948Z INFO [input.filestream] map[file.line:321 file.name:filestream/input.go] Reader was closed. Closing.#011{"ecs.version": "1.6.0"}
2023-03-28T23:38:24.943776+00:00 syslog-c01n01 filebeat[22734]: 2023-03-28T23:38:24.943Z INFO [input.filestream] map[file.line:321 file.name:filestream/input.go] Reader was closed. Closing.#011{"ecs.version": "1.6.0"}
2023-03-28T23:38:24.954247+00:00 syslog-c01n01 filebeat[22734]: 2023-03-28T23:38:24.954Z INFO [input.filestream] map[file.line:321 file.name:filestream/input.go] Reader was closed. Closing.#011{"ecs.version": "1.6.0"}
2023-03-28T23:38:24.958732+00:00 syslog-c01n01 filebeat[22734]: 2023-03-28T23:38:24.958Z INFO [input.filestream] map[file.line:321 file.name:filestream/input.go] Reader was closed. Closing.#011{"ecs.version": "1.6.0"}

Would you prefer I opened a different topic for that since it doesn't match the original Subject ? I'd be happy to. Let me know.

Thanks for all your help so far.

@Alex_Stuck
Awesome progress! Kudos on the cleverness... Putting that one in my back pocket! :slight_smile:

Also pay attention closely to @leandrojmp suggestions about tuning logstash. He has quite a bit of experience tuning logstash... I suspect increasing that batch_size would also help tremendously.

pipelining perhaps, but I would probably start with Leandro's suggestions next

@andrewkroh do you know what these logs are?

This topic was automatically closed 28 days after the last reply. New replies are no longer allowed.