Hi everybody,
I have setup an BLEK (Beats, Logstash, ElasticSearch, Kibana) stack 
- ES and Kibana are running in ES Cloud
- a "cluster" of Logstash instances are running on a Kubernetes cluster
- A service and Filebeat are running from an other kubernetes cluster.
The logstash has been deployed from Helm & Filebeat while using the AllInOne file provided by the "getting Started" page of ES doc.
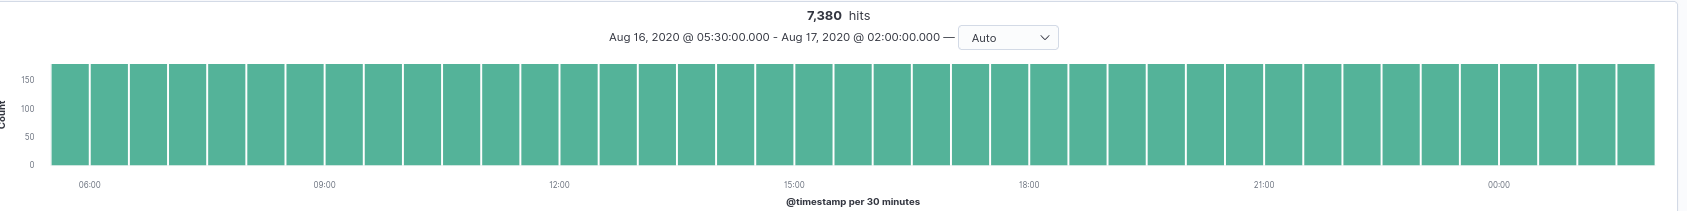
At some point I have a hole in my log collection for one of my service:

The local Filebeat does not seems to complain. But all I get is filebeat saying it has metrics
The aggregator layer with Logstash does not say much more during the same time window:

The events after 00:00 seems related to an other issue that has nothing to do with this one (Complaining not beeing able to write in the index logs-xxxx-2020-08-15 which has been moved to other nodes by the LifeCyclePolicy whereas we are 2020-08-17 ...)
But the shipped-in collectionof GCP shows logs ....

Does some one have a hint or an idea where I can start looking at ?
About the config of Logstash:
input: beats
output: elasticsearch
By looking at Kubernetes, neither Filebeat or logstash pods have restarted for months ...
This gives me serious doubts about the reliability of the BLEK stack 