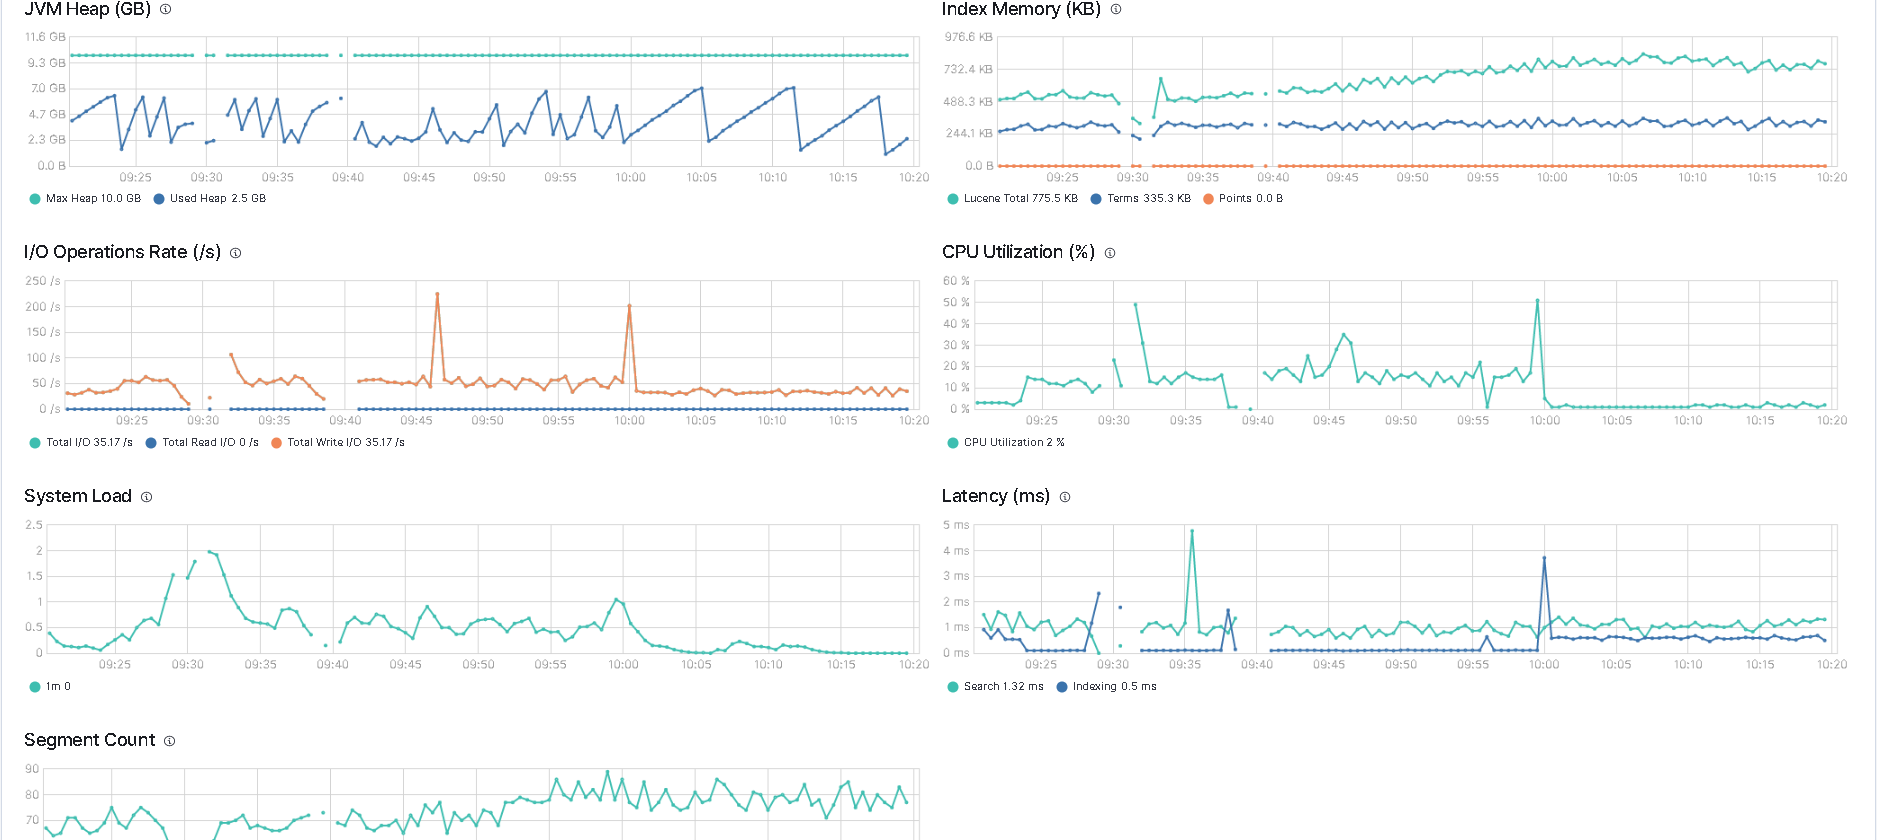
here's a new screenshot from when i'm trying the python insert:
i got the following exception from parallel_bulk: unavailable_shards_exception
heres my python script:
def es_bulk(inputfile,thread_count,batch_size):
    import csv
    from elasticsearch import Elasticsearch, helpers

    es = Elasticsearch(
        hosts=['es-m02','es-m03','es-d01','es-d02'],
        port=9200,
        timeout=120
    )

    with open(inputfile) as f:
        reader = csv.DictReader(
            f,
            delimiter='|',
            fieldnames=['f1','f2','f3','f4','f5','f6','f7','f8']
        )
        for success, info in helpers.parallel_bulk(es, reader, thread_count=thread_count, chunk_size=batch_size, index='my.index', request_timeout=120):
            if not success:
                errorfile=os.path.join(os.path.dirname(inputfile),"error",os.path.basename(inputfile))
                with open(errorfile, 'w') as ef:
                    print >> ef, info
                ef.close()
please node, it doesnt look like the error writting/logging is working, because it just barfs a bunch of json on the screen instead of outputting to the log. so i'm not sure i'm doing that part correctly.
also worth a note, kibana, and my elected master is es-01 which is why it's not in the hosts list.
lmk if you guys see anything i can/should adjust.
if i run just one import, it seems to work fine, if i wait a long period of time inbetween additional inserts, it seems okay too. but i have to wait like 30 mintues before i can insert another file, or it'll blow up.
also found this in recent log entries:
Recent Log Entries
Showing the most recent log entries for this cluster, up to 10 total log entries.

This table contains 10 rows.
Timestamp
Level
Type
Message
Component
Node
April 20, 2021 4:47:48 PM
INFO
Server
{"type": "server", "timestamp": "2021-04-20T16:47:48,791Z", "level": "INFO", "component": "o.e.m.j.JvmGcMonitorService", "cluster.name": "my-cluster", "node.name": "es-d02", "message": "[gc][70007] overhead, spent [262ms] collecting in the last [1s]", "cluster.uuid": "eUv12yWkRkmLIcYU2qFU2A", "node.id": "7frrjjyDRtykC5EKSqwRrw" }
o.e.m.j.JvmGcMonitorService
es-d02
April 20, 2021 4:40:18 PM
WARN
Server
Received response for a request that has timed out, sent [24.4s/24416ms] ago, timed out [9.6s/9607ms] ago, action [indices:monitor/stats[n]], node [{es-d01}{AQOeyh6hT7yv6caZUX1JPg}{WCzVZeWJSRGshvJsfgYL_g}{192.168.4.63}{192.168.4.63:9300}{cdfhilrstw}{ml.machine_memory=16819191808, ml.max_open_jobs=20, xpack.installed=true, ml.max_jvm_size=10737418240, transform.node=true}], id [1187962]
o.e.t.TransportService
es-m01
April 20, 2021 4:40:08 PM
WARN
Server
failed to retrieve shard stats from node [AQOeyh6hT7yv6caZUX1JPg]: [es-d01][192.168.4.63:9300][indices:monitor/stats[n]] request_id [1187962] timed out after [14809ms]
o.e.c.InternalClusterInfoService
es-m01
April 20, 2021 4:40:00 PM
WARN
Server
Received response for a request that has timed out, sent [11.2s/11207ms] ago, timed out [1.2s/1200ms] ago, action [internal:coordination/fault_detection/follower_check], node [{es-d01}{AQOeyh6hT7yv6caZUX1JPg}{WCzVZeWJSRGshvJsfgYL_g}{192.168.4.63}{192.168.4.63:9300}{cdfhilrstw}{ml.machine_memory=16819191808, ml.max_open_jobs=20, xpack.installed=true, ml.max_jvm_size=10737418240, transform.node=true}], id [1187924]
o.e.t.TransportService
es-m01
April 20, 2021 4:39:36 PM
WARN
Server
Received response for a request that has timed out, sent [10.6s/10607ms] ago, timed out [600ms/600ms] ago, action [internal:coordination/fault_detection/follower_check], node [{es-d01}{AQOeyh6hT7yv6caZUX1JPg}{WCzVZeWJSRGshvJsfgYL_g}{192.168.4.63}{192.168.4.63:9300}{cdfhilrstw}{ml.machine_memory=16819191808, ml.max_open_jobs=20, xpack.installed=true, ml.max_jvm_size=10737418240, transform.node=true}], id [1187682]
o.e.t.TransportService
es-m01
April 20, 2021 4:39:34 PM
WARN
Server
Received response for a request that has timed out, sent [19.6s/19613ms] ago, timed out [9.6s/9607ms] ago, action [internal:coordination/fault_detection/follower_check], node [{es-d01}{AQOeyh6hT7yv6caZUX1JPg}{WCzVZeWJSRGshvJsfgYL_g}{192.168.4.63}{192.168.4.63:9300}{cdfhilrstw}{ml.machine_memory=16819191808, ml.max_open_jobs=20, xpack.installed=true, ml.max_jvm_size=10737418240, transform.node=true}], id [1187587]
o.e.t.TransportService
es-m01
April 20, 2021 4:39:10 PM
WARN
Server
Received response for a request that has timed out, sent [10.8s/10809ms] ago, timed out [801ms/801ms] ago, action [internal:coordination/fault_detection/follower_check], node [{es-d01}{AQOeyh6hT7yv6caZUX1JPg}{WCzVZeWJSRGshvJsfgYL_g}{192.168.4.63}{192.168.4.63:9300}{cdfhilrstw}{ml.machine_memory=16819191808, ml.max_open_jobs=20, xpack.installed=true, ml.max_jvm_size=10737418240, transform.node=true}], id [1187485]
o.e.t.TransportService
es-m01
April 20, 2021 4:38:51 PM
WARN
Server
Received response for a request that has timed out, sent [9.8s/9814ms] ago, timed out [0s/0ms] ago, action [internal:coordination/fault_detection/leader_check], node [{es-m01}{roWYC3m8S1ipqbvyNaEoxQ}{oCYL4tVXRNK3s0zG8bTiCw}{192.168.4.60}{192.168.4.60:9300}{ilmr}{ml.machine_memory=16819191808, ml.max_open_jobs=20, xpack.installed=true, ml.max_jvm_size=10737418240, transform.node=false}], id [407915]
o.e.t.TransportService
es-d01
April 20, 2021 4:38:10 PM
WARN
Server
Received response for a request that has timed out, sent [19.4s/19458ms] ago, timed out [9.4s/9444ms] ago, action [internal:coordination/fault_detection/leader_check], node [{es-m01}{roWYC3m8S1ipqbvyNaEoxQ}{oCYL4tVXRNK3s0zG8bTiCw}{192.168.4.60}{192.168.4.60:9300}{ilmr}{ml.machine_memory=16819191808, ml.max_open_jobs=20, xpack.installed=true, ml.max_jvm_size=10737418240, transform.node=false}], id [407686]
o.e.t.TransportService
es-d01
April 20, 2021 4:38:08 PM
WARN
Server
Received response for a request that has timed out, sent [28.4s/28452ms] ago, timed out [18.4s/18447ms] ago, action [internal:coordination/fault_detection/leader_check], node [{es-m01}{roWYC3m8S1ipqbvyNaEoxQ}{oCYL4tVXRNK3s0zG8bTiCw}{192.168.4.60}{192.168.4.60:9300}{ilmr}{ml.machine_memory=16819191808, ml.max_open_jobs=20, xpack.installed=true, ml.max_jvm_size=10737418240, transform.node=false}], id [407664]
o.e.t.TransportService
es-d01