I'm trying to recreate the stack monitoring page for Logstash 7.6 in a dashboard , specifically so that I can see throughput for a physical node that has multiple Logstash instances deployed on it, as shown in another post.
Right now I get three choices for viewing Logstash document throughput:
- Throughput for the cluster (which contains multiple physical nodes - each with their own multiple instances) - Not granular enough
- Throughput per instance - too granular as many of these are running on a physical node
- Throughput per pipeline per instance - too granular
I've opened up the .monitoring-logstash-* index pattern and tried to get throughput per physical machine by calculating the rates of the field logstash_stats.events.in, but these numbers are way too high.
What field in this index is being used to determine actual document index rate by the Logstash service?
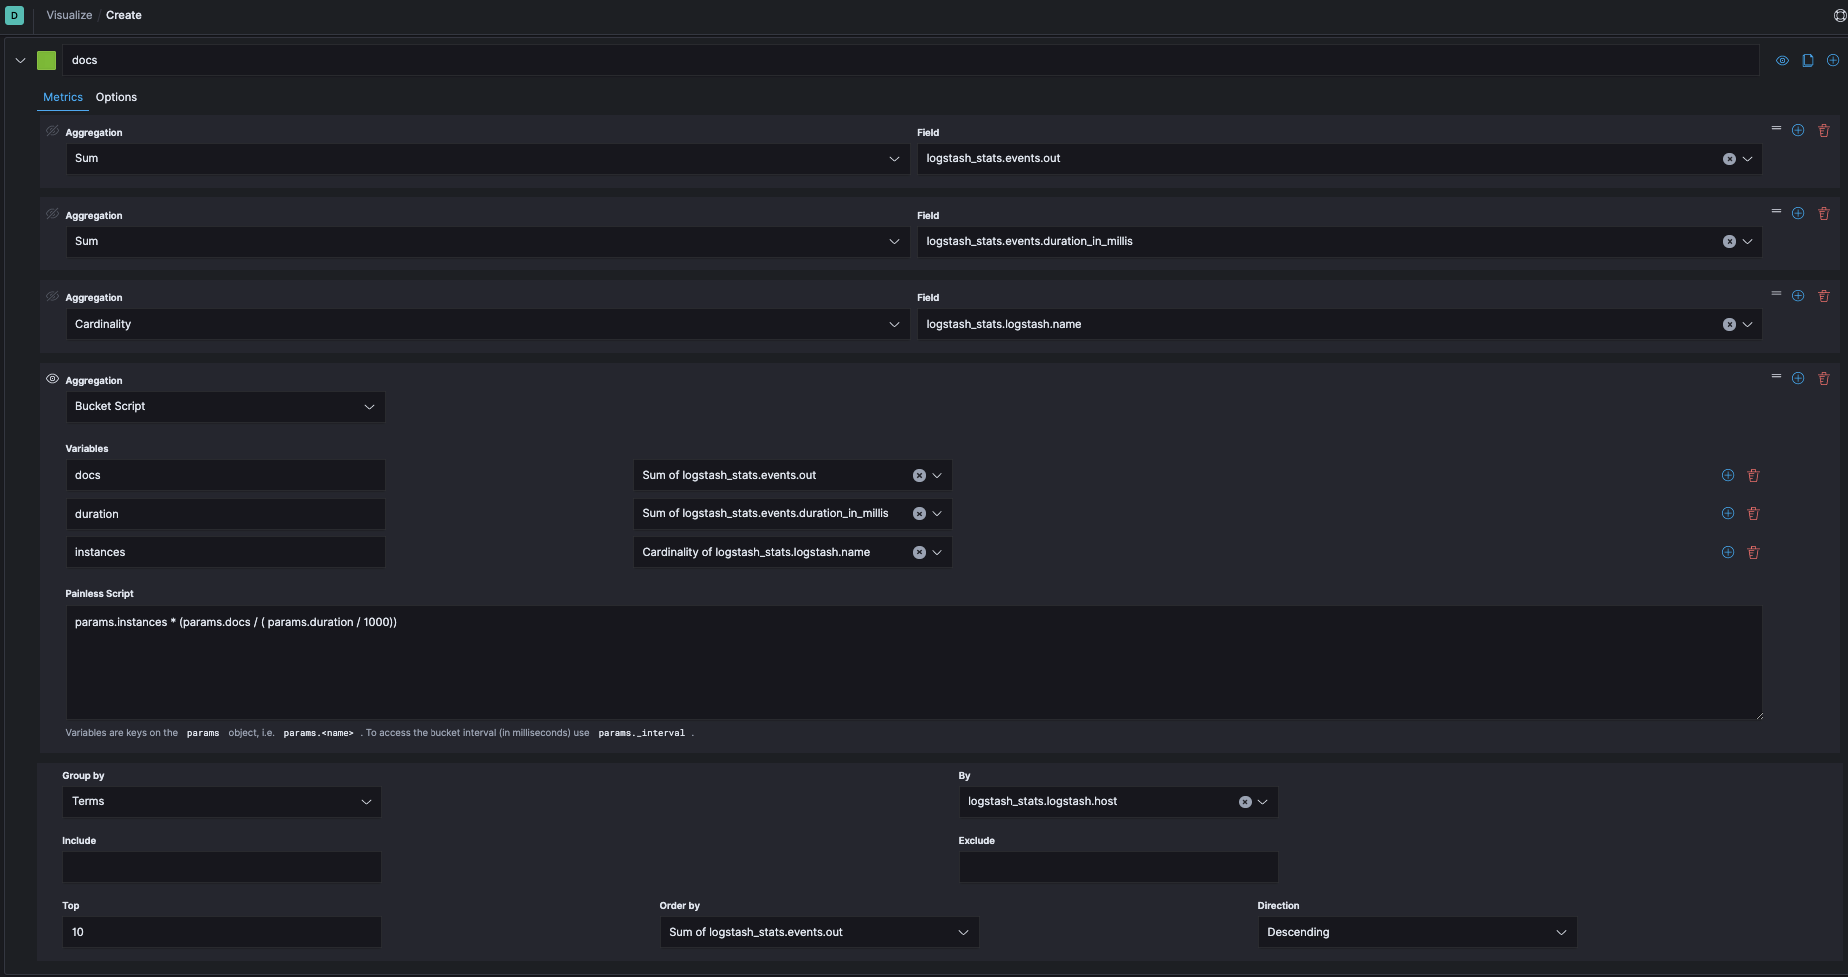
Here's an example of me trying to recreate the Logstash Stack Monitoring 'Events Received Rate (/s)':

But these numbers are way too high - there's no way I'm receiving 70M docs every 30s on one physical machine, which is also way higher than I see on the overview page as well..: