How to link input contain to output contain

Hi,

I have a question. I have this in my input file :

root@Big-Monster:/etc/logstash/conf.d# cat 00_input.conf
input {
  file {
    id => "TEST-Syslog"
    path => [ "/var/log/syslog" ]
  }


  file {
    id => "TEST-Cron"
    path => [ "/var/log/cron.log" ]
  }
}


And that in my output file :

root@Big-Monster:/etc/logstash/conf.d# cat 99_output.conf
output {
  elasticsearch {
    id => "TEST-output-Syslog"
    hosts => [ "127.0.0.1" ]
    index => "syslog-%{+YYYY.MM.dd}"
    }
}

So, for now, in theory (in theory because, my config doesn't work, for now... I opened another subject about it : Impossible to create a second index), my logs "syslog" and my log "cron" should appears in one pipeline, on kibana, according this principle :

My question is : instead to have multiple pipeline, with 2 files input and output, here, is that possible to have 2 output configuration in the same file, as for the file input ?

Something like that :

root@Big-Monster:/etc/logstash/conf.d# cat 99_output.conf
output {
  elasticsearch {
    id => "TEST-output-Syslog"
    hosts => [ "127.0.0.1" ]
    index => "syslog-%{+YYYY.MM.dd}"
    }

  elasticsearch {
    id => "TEST-output-Cron"
    hosts => [ "127.0.0.1" ]
    index => "Cron-%{+YYYY.MM.dd}"
    }
}

I tested that, but that didn't work. Maybe that is not possible. But if that is, how make in sort the application will redirect the logs to the good output ? I mean : how to make in sort the logs configured to the input "cron" be redirected to the output "cron" and not the output "syslog" ? Maybe we must have the same ID in both configuration input, ouput for cron, or something like that ? Maybe there is some subtility I missed.

Best regards,
Christ

This seems to be related to your previous question, please avoid opening duplicate questions.

If you want data from your syslog file to go th the syslog-YYYY.MM.dd index and data from your cron file to go to the cron-YYYY.MM.dd index, the best approach is to use multiple pipelines.

You will need one pipeline for your syslog file and another one to your cron file.

For example, you can have a syslog.conf and cron.conf

syslog.conf

input {
  file {
    id => "TEST-Syslog"
    path => [ "/var/log/syslog" ]
  }
}

output {
  elasticsearch {
    id => "TEST-output-Syslog"
    hosts => [ "127.0.0.1" ]
    index => "syslog-%{+YYYY.MM.dd}"
  }
}

and

cron.conf

input {
  file {
    id => "TEST-Cron"
    path => [ "/var/log/cron.log" ]
  }
}

output {
  elasticsearch {
    id => "TEST-output-Cron"
    hosts => [ "127.0.0.1" ]
    index => "cron-%{+YYYY.MM.dd}"
  }
}

Then you should update your pipelines.yml to this one:

- pipeline.id: syslog
  path.config: "/etc/logstash/conf.d/syslog.conf"
- pipeline.id: cron
  path.config: "/etc/logstash/conf.d/cron.conf"

Hi,

mmmm I tried your configuration. Before all, thanks again, because I see where I was wrong, before. Last time I configured multiple pipeline, I had the good configuration in the pipelines.yml, but I kept the input/output separated in 2 files. In fact, we must have one file with the input/output in the same file, apparently. That seems more logic, now.

So... I removed my first configuration, including the index syslog I had, to begin with something new, configured 2 files in my conf.d, "syslog.conf" and "cron.conf". I updated my pipeline.yml. I restarted it with "/usr/share/logstash/bin/logstash --path.settings /etc/logstash -f /etc/logstash/conf.d/cron.conf and /usr/share/logstash/bin/logstash --path.settings /etc/logstash -f /etc/logstash/conf.d/syslog.conf ... I see now the index cron :

root@Big-Monster:/usr/share/logstash# curl -XGET 'localhost:9200/_cat/indices?v'
health status index                uuid                   pri rep docs.count docs.deleted store.size pri.store.size
yellow open   cron-2023.11.21      AoYTsFqJQiewvMj1_rJQ0g   5   1       3705            0      1.3mb          1.3mb
green  open   .kibana_1            ML69D0WfRaSC3v1-aZpr_A   1   0          6            1     30.2kb         30.2kb
green  open   .kibana_task_manager _uJwCVxeSaiyRCSOXAqAIQ   1   0          2            0     12.6kb         12.6kb

But I do not see the index syslog... Apparently I must change the line "path.data" :

[2023-11-21T15:52:41,762][FATAL][logstash.runner          ] Logstash could not be started because there is already another instance using the configured data directory.  If you wish to run multiple instances, you must change the "path.data" setting.

Ok... That is in the logstash.yml.

root@Big-Monster:/etc/logstash# cat logstash.yml | grep path.data
path.data: /var/lib/logstash
# Default is path.data/queue
# Default is path.data/dead_letter_queue

If I understand well, we are supposed to have one path data a pipeline. Or, maybe, one global path, example, /var/lib/logstash, but with a repo, inside, for each configuration. It is not yet clear. I am reading what that say on internet. According one link I find, " By default its value is set to, LOGSTASH_HOME/data, which, under debian and rpm is /usr/share/logstash/data, and it is automatically assigned to first logstash instance unless explicitly specified". In my case (under Ubuntu), that is /var/lib/logstash, aparrently, anyway. Notice, /usr/share/logstash exist too, in my system, and contain the same things (dead_letter_queue plugins queue uuid) than in /var/lib/logstash. So I suppose that exist by default anyway, even if it is not used.

Brief... I search how that must be configured.

Best regards,
Chris

There is another Logstash instance running in your system.

This will start two instances of logstash, which is the cause of the error you shared, when using pipelines.yml it is best to run Logstash as a system service, not using the command line.

Running this way, using the -f option will also make losgtash ignore the pipelines.yml file.

Also, you should avoid running Logstash as the root user, this will generate multiple problems if you want to run it as a service in the future.

If you want to run logstash using the command line and use pipelines.yml you need to run just like this:

/usr/share/logstash/bin/logstash --path.settings /etc/logstash

Well, for now, I am just testing the configurations. If that is not too much disturbing, I will check later to start the service as "myself" and not as root. Because I will have to fix the rights to be able to do that, first. For now, I just discovering how the that works, and you help me a lot, for that. Therefore, ok, I take accounf of your suggestion. I will correct myself, in any cases.

What do you mean by "it is best to run Logstash as a system service, not using the command line" ? I thought the "-f' was to force the application to read again the configuration, to apply the changes, if changes there is.

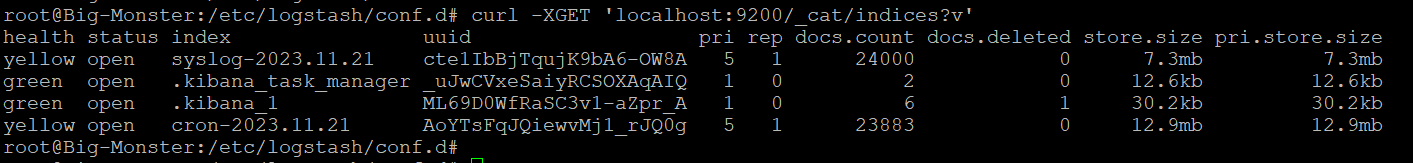
Anyway, I tried your cmd, and I just obtain that :

root@Big-Monster:~# /usr/share/logstash/bin/logstash --path.settings /etc/logstash
OpenJDK 64-Bit Server VM warning: Option UseConcMarkSweepGC was deprecated in version 9.0 and will likely be removed in a future release.
WARNING: An illegal reflective access operation has occurred
WARNING: Illegal reflective access by com.headius.backport9.modules.Modules (file:/usr/share/logstash/logstash-core/lib/jars/jruby-complete-9.2.7.0.jar) to field java.io.FileDescriptor.fd
WARNING: Please consider reporting this to the maintainers of com.headius.backport9.modules.Modules
WARNING: Use --illegal-access=warn to enable warnings of further illegal reflective access operations
WARNING: All illegal access operations will be denied in a future release
Sending Logstash logs to /var/log/logstash which is now configured via log4j2.properties
[2023-11-21T16:18:53,056][INFO ][logstash.runner          ] Starting Logstash {"logstash.version"=>"6.8.23"}
[2023-11-21T16:18:55,881][INFO ][logstash.pipeline        ] Starting pipeline {:pipeline_id=>"cron", "pipeline.workers"=>4, "pipeline.batch.size"=>125, "pipeline.batch.delay"=>50}
[2023-11-21T16:18:55,953][ERROR][logstash.agent           ] Failed to execute action {:action=>LogStash::PipelineAction::Create/pipeline_id:syslog, :exception=>"LogStash::ConfigurationError", :message=>"Expected one of #, => at line 8, column 17 (byte 106) after input {\n  file {\n    id => \"TEST-Syslog\"\n    path => [ \"/var/log/syslog\" ]\n  }\n\noutput {\n  elasticsearch ", :backtrace=>["/usr/share/logstash/logstash-core/lib/logstash/compiler.rb:41:in `compile_imperative'", "/usr/share/logstash/logstash-core/lib/logstash/compiler.rb:49:in `compile_graph'", "/usr/share/logstash/logstash-core/lib/logstash/compiler.rb:11:in `block in compile_sources'", "org/jruby/RubyArray.java:2577:in `map'", "/usr/share/logstash/logstash-core/lib/logstash/compiler.rb:10:in `compile_sources'", "org/logstash/execution/AbstractPipelineExt.java:151:in `initialize'", "/usr/share/logstash/logstash-core/lib/logstash/pipeline.rb:22:in `initialize'", "/usr/share/logstash/logstash-core/lib/logstash/pipeline.rb:90:in `initialize'", "/usr/share/logstash/logstash-core/lib/logstash/pipeline_action/create.rb:43:in `block in execute'", "/usr/share/logstash/logstash-core/lib/logstash/agent.rb:96:in `block in exclusive'", "org/jruby/ext/thread/Mutex.java:165:in `synchronize'", "/usr/share/logstash/logstash-core/lib/logstash/agent.rb:96:in `exclusive'", "/usr/share/logstash/logstash-core/lib/logstash/pipeline_action/create.rb:39:in `execute'", "/usr/share/logstash/logstash-core/lib/logstash/agent.rb:334:in `block in converge_state'"]}
[2023-11-21T16:18:56,259][INFO ][logstash.outputs.elasticsearch] Elasticsearch pool URLs updated {:changes=>{:removed=>[], :added=>[http://127.0.0.1:9200/]}}
[2023-11-21T16:18:56,446][WARN ][logstash.outputs.elasticsearch] Restored connection to ES instance {:url=>"http://127.0.0.1:9200/"}
[2023-11-21T16:18:56,492][INFO ][logstash.outputs.elasticsearch] ES Output version determined {:es_version=>6}
[2023-11-21T16:18:56,495][WARN ][logstash.outputs.elasticsearch] Detected a 6.x and above cluster: the `type` event field won't be used to determine the document _type {:es_version=>6}
[2023-11-21T16:18:56,514][INFO ][logstash.outputs.elasticsearch] New Elasticsearch output {:class=>"LogStash::Outputs::ElasticSearch", :hosts=>["//127.0.0.1"]}
[2023-11-21T16:18:56,527][INFO ][logstash.outputs.elasticsearch] Using default mapping template
[2023-11-21T16:18:56,554][INFO ][logstash.outputs.elasticsearch] Attempting to install template {:manage_template=>{"template"=>"logstash-*", "version"=>60001, "settings"=>{"index.refresh_interval"=>"5s"}, "mappings"=>{"_default_"=>{"dynamic_templates"=>[{"message_field"=>{"path_match"=>"message", "match_mapping_type"=>"string", "mapping"=>{"type"=>"text", "norms"=>false}}}, {"string_fields"=>{"match"=>"*", "match_mapping_type"=>"string", "mapping"=>{"type"=>"text", "norms"=>false, "fields"=>{"keyword"=>{"type"=>"keyword", "ignore_above"=>256}}}}}], "properties"=>{"@timestamp"=>{"type"=>"date"}, "@version"=>{"type"=>"keyword"}, "geoip"=>{"dynamic"=>true, "properties"=>{"ip"=>{"type"=>"ip"}, "location"=>{"type"=>"geo_point"}, "latitude"=>{"type"=>"half_float"}, "longitude"=>{"type"=>"half_float"}}}}}}}}
[2023-11-21T16:18:56,763][INFO ][logstash.inputs.file     ] No sincedb_path set, generating one based on the "path" setting {:sincedb_path=>"/var/lib/logstash/plugins/inputs/file/.sincedb_9b0a58bc044ee19bc5c8f85111fa6dce", :path=>["/var/log/cron.log"]}
[2023-11-21T16:18:56,833][INFO ][filewatch.observingtail  ] START, creating Discoverer, Watch with file and sincedb collections
[2023-11-21T16:18:57,079][INFO ][logstash.agent           ] Successfully started Logstash API endpoint {:port=>9600}

(and nothing else. The command do not give me back the prompt, except if I do a ctrl C).

Best regards,
Chris

And I still do not see my "syslog", in the index's list. Sorry, forgot to precise.

Rgs,
Chris

Check the logs, you have an ERROR log for the syslog pipeline, something is not right in your configuration file.

Validate the file and try again, check if all curly brackets are being correctly closed.

Found.

It missed a "}". I corrected it and I have done a new "/usr/share/logstash/bin/logstash --path.settings /etc/logstash"

Damn, it seems so easy, now... Thank to you I fully understand how to use the pipelines. It is not well explained, on the elasticSearch website. I do not critic them, because they added a lot of useful things, no pb with that, but they should too add examples of configurations to permit us to well understand how to use their config.

So just to well understand :

-Why the -f is not good ? I would be happy to clarify your explanation about " it is best to run Logstash as a system service, not using the command line. Running this way, using the -f option will also make losgtash ignore the pipelines.yml file.". In both case, with or without the "-f" it is question to start the application in command line, anyway.

-By the same occasion, why the -f ignore the pipeline.yml. It is one of the both central configuration file of the application, logically. That means it should be take in account if we do a -f, which correspond to a --path.config, apparently.

-Why, too, I must use the --path.settings /etc/logstash ? There is no configuration to amend somewhere in logstath to indicate to indicate that the settings are in /etc/logstash, to avoid that ? According to me (according my logic... :p), the application, by default, should have /etc/logstash be default indicated somewhere... Brief... I suppose I can find more pieces of explanation about this point in particular.

-About the past.data, thanks again for your cmd. :slight_smile: But, one question. Wouldn't be not enough to stop the application then to restart it ? systemctl stop/start logstash, if you prefer. It doesn't read again the configuration as would do the logstash --path.setting ?

So, My customer have a similar configuration than mine, earler, with 2 entries in one input file, and 1 entry in the output file. That mean, to summarize, I will have to break his configuration, update the pipeline.yml, and his configuration in his conf.d as I have done for myself. Then restart the service, as you have done. Ok, ok... I suppose that means he will lost the access to his oldest data on Kibana, in this case (or not... After all, maybe I do not have to delete the old index, in Kibana. I can just add the new one by letting the old one, even if the old index do not work anymore). To contextualize, the customer use ELK to receive datas from a firewall Fortigate. And we must add a new configuration to receive on the ELK server, datas from Load balancer Netscaler. Fortunatly, the config, on the Netscaler itself is easy.

Normally, I should have something like that (I will test it from a clone, to avoid a mess. Like that if I am wrong, that should be a big deal) :

input {
  udp {
	type => "Netscaler"
	port => "66514"
	balises => ["Netscaler"]
  }
}
output {
        if ([type]=="Netscaler"){
    elasticsearch {
    id => "elasticsearch"
    hosts => [ "127.0.0.1" ]
    Index => “logstash-local-Netscaler-%{+YYY.MM.dd}”

                }
        }

Well I will continue to dig the application. I must check how the grok work, now. Because I guess Netscaler will send a lot of pieces of information, and I surely will have to understand how to sort them, on Kibana. For that, in amont, I will have to understand how configure the file "filter".

It is interesting, really. Thanks again !!!

Best regards,
Chris

The -f flag, is the short flag for the --path.config flag, as explained in the documentation.

This flag wil tell logstash which configuraion file to run, but using the -f flag will make logstash ignore the pipelines.yml, the pipelines.yml is used to also tell logstash which configuration it needs to run, so you cannot use -f and also use the `pipelines.yml.

This is also explained in the documentation.

When you start Logstash without arguments, it will read the pipelines.yml file and instantiate all pipelines specified in the file. On the other hand, when you use -e or -f, Logstash ignores the pipelines.yml file and logs a warning about it.

Because the Logstash binary needs to now where the settings are, the --path.settings is the path where the files logstash.yml, pipelines.yml, jvm.options and log4j2.properties are stored.

I suggest that you check the documentation for a more in depth explanation of how Logstash works and how to configure it.

Aaah, ok

All right, I have the base. And yes, I will read it again. And better.

Thanks !

Best regards,
Chris

This topic was automatically closed 28 days after the last reply. New replies are no longer allowed.