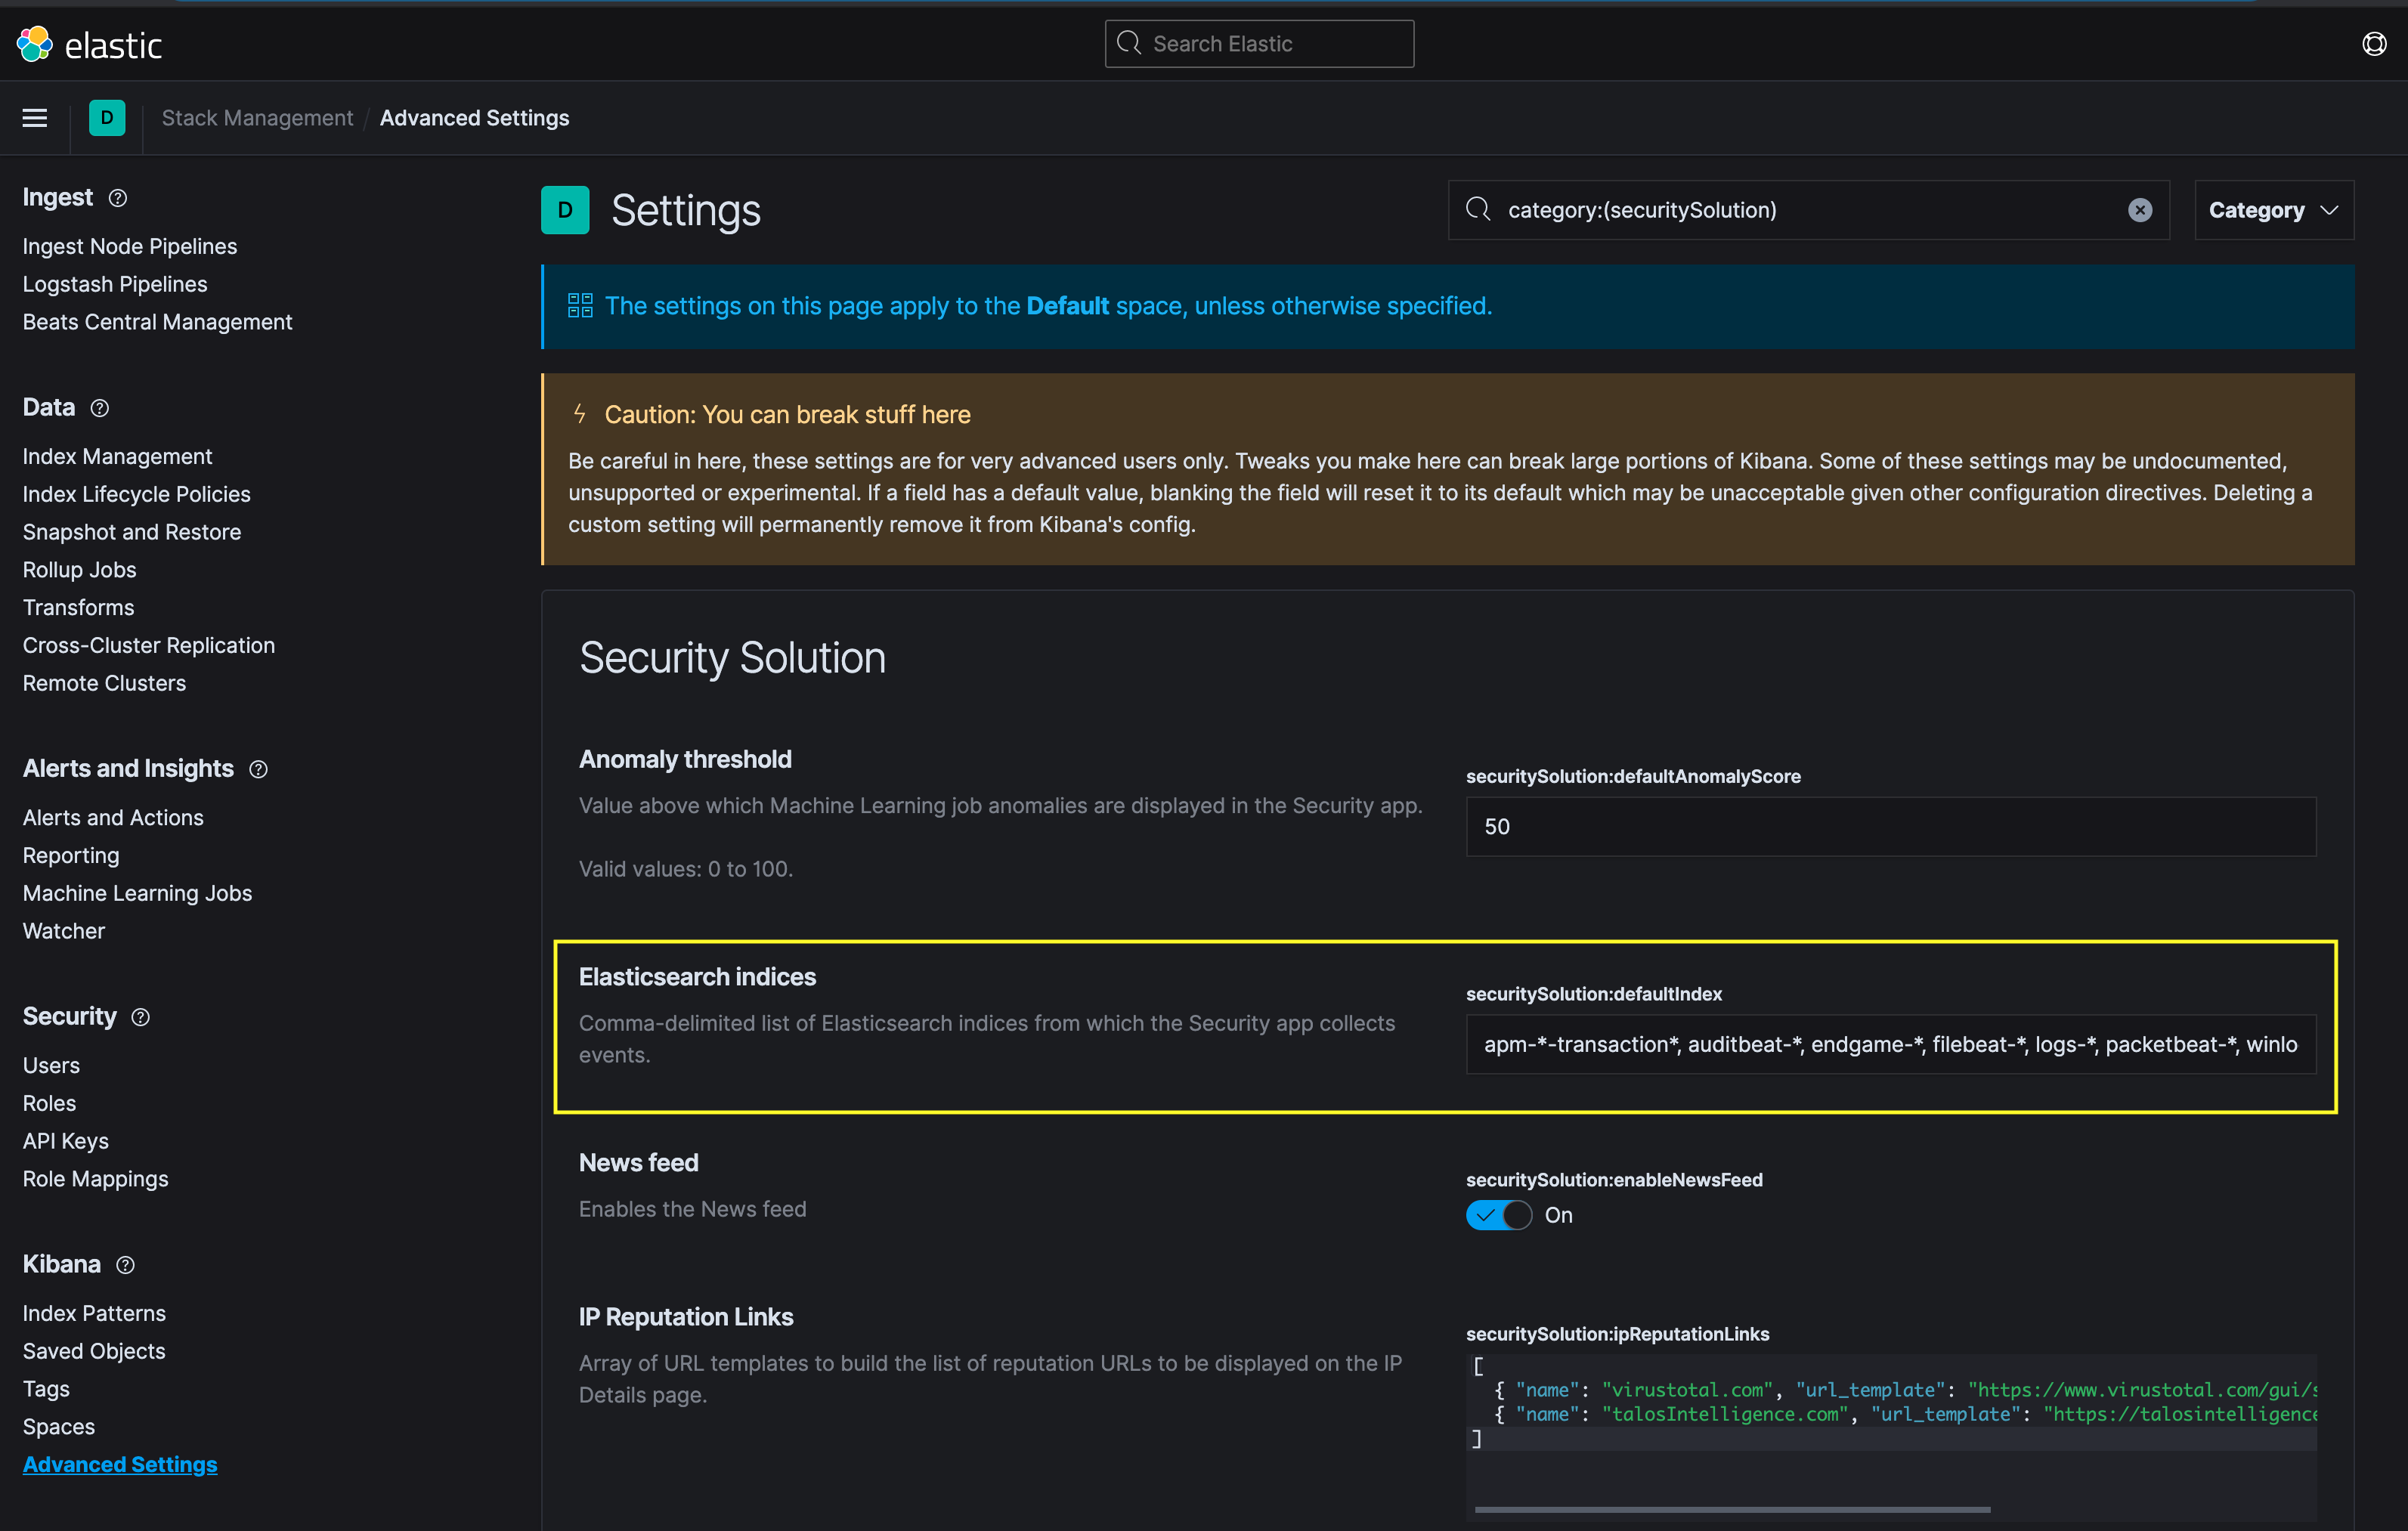
By default, the Security solution uses the following Elasticsearch indices specified by the securitySolution:defaultIndex setting in Kibana Advanced settings:
You may add additional ECS-conforming indices to the setting shown in the screenshot above.
After adding the indices to the securitySolution:defaultIndex setting, they will be represented in the Events widget shown in the screenshot you provided, however they will not be shown in the Network events widget on the Overview, because that widget counts events from specific agent.types, i.e. agent.type: "auditbeat".
We're always open: Inspect the queries that power the Security app
Tip: You may hover over widgets throughout the Security app and click Inspect to view the Elasticsearch query that powers the widget.
For example, hover over the Network events widget and click the Inspect button:
Thanks again for your question and feedback @111387! It's not possible to customize the query in the current implementation, so I created the following Github issue to track this feature as part of a refreshed design of the Host events and Network events:
I linked the issue above to this post. Please feel free to comment directly in that issue or in this post with any additional details that might be relevant to your specific use case, as this may help inform the new design.
Apache, Apache Lucene, Apache Hadoop, Hadoop, HDFS and the yellow elephant
logo are trademarks of the
Apache Software Foundation
in the United States and/or other countries.