Hello everyone!
I am trying to get a dashboard in Kibana of several HTML LOG files... the patter of those logs are like this example:
<META http-equiv="Content-Type" content="text/html; charset=UTF-8"> <title> Job </title> <style type="text/css"> body {font-family: verdana,arial,sans-serif; font-size:10pt;} h1 {font-size: 14pt } h2 {font-size: 12pt } table, tr, td, th {border: 1px; border-spacing: 0px; border-collapse: collapse;font-size:10pt; text-align: left} td, th { padding: 5px; } th { padding-left: 0px; } a:link,a:visited { text-decoration: none; } </style> </head> <body> <h1>Job 30226863</h1> <table> <tr> <th>Domain</th><td>idcs-5e64742091c341b58db050b43599e161</td> </tr> <tr> <th>Service</th><td>Database20180625203859QS</td> </tr> <tr> <th>Namespace</th><td>cloudstack</td> </tr> <tr> <th>Service Type</th><td>CloudStack</td> </tr> <tr> <th>Compute Site</th><td>uscom-central-1</td> </tr> <tr> <th>Username</th><td>siyuan15@uw.edu</td> </tr> <tr> <th>Operation</th><td>create-psm-stack-service</td> </tr> <tr> <th>Status</th><td>Failed</td> </tr> <tr> <th>Sub Status</th><td></td> </tr> <tr> <th>Create Time</th><td>2018-06-25T20:40:06.656+00:00</td> </tr> <tr> <th>Start Time</th><td>2018-06-25T20:40:06.656+00:00</td> </tr> <tr> <th>End Time</th><td>2018-06-25T21:28:35.417+00:00</td> </tr> <tr> <th>Update Time</th><td>2018-06-25T21:28:35.419+00:00</td> </tr> <tr> <th>Job Info</th><td></td> </tr> <tr> <th>Request Parameters</th><td>{{{namespace=cloudstack, serviceInstance=Database20180625203859QS, securityAuthUser=siyuan15@uw.edu, is_sit_service=false, serviceType=CloudStack, isUpdateRequest=true, quick_start_instance=true, parent_agg r_service_name=Database20180625203859QS, stack_service_base_uri=https://paassvcmngrinternal-us2-sm02.oraclecloud.com:8888/paas/, OPERATION_SERVICE_TYPE=CloudStack, activityType=CREATE_SERVICE, stackTemplate=Oracle-DBCS-Enterprise-Edition :1.0.4, tenant=idcs-5e64742091c341b58db050b43599e161, serviceVersion=All, serviceName=Database20180625203859QS, serviceId=733181, operationName=create-psm-stack-service}}}</td> </tr> <tr> <th>Supplemental Logs</th><td>none</td> </tr> <tr> <th>Summary</th><td> <pre>Job <30226863> v11, action=handleFailure, Failed, namespace=cloudstack, service type=CloudStack, version=All, operation=create-psm-stack-service, cleanupActionIndex=-1, retryCount:0, jobRetryCount:0, jobRetryWaitTime:0, create d: 2018-06-25T20:40:06.656+0000, started: 2018-06-25T20:40:06.656+0000, failingStartTime: 2018-06-25T21:28:35.272+0000, domain:idcs-5e64742091c341b58db050b43599e161, instance:Database20180625203859QS, wm:SM-MS-chr302ru26.usdc2.oracleclo, owner:siyuan15@uw.edu FAILED CURRENT JOB 30226863: action: createChildJobsLevel1 FAILED CHILD JOB 30226864: action: createServiceAssociation FAILED CHILD JOB 29985247: action: addTags, job trail: 30226863 > 30226864 > 29985247 code: sm.job.unexpected.execution, message: sm.job.unexpected.execution: An exception occurred during operation execution: action: com.oracle.cloudservice.db.service.operation.CreateDBaaSServiceOperation, addTags</pre> </td> </tr>
I created this file.conf in Logstash and it is "working"...
# THIS FILE HAS THE INPUT + FILTER AND OUTPUT OF HTML FILES (FOR THE BUGS)
# THIS IS THE INPUT CONFIGURATION
input {
  file {
    id => "htmlLogs_input_file"
    path => "/home/logs/create-dbaas-service/*.htm"
    type => "htm"
    start_position => beginning
    sincedb_path => "/dev/null"
  }
}
# THIS IS THE FILTER CONFIGURATION
filter {
  if [type] == "htm" {
    grok {
      id => "htmlLogs_filter_grok"
      match => { "message" => "<h1>%{DATA:Job_word}%{SPACE}%{NUMBER:job_id}</h1><table><tr><th>%{DATA:Domain_word}</th><td>%{DATA:Domain_id}</td></tr><tr><th>%{DATA:Service_word}</th><td>%{DATA:Service_id}</td></tr><tr><th>%{DATA:Namespace_word</th><td>%{DATA:Namespace_type}</td></tr><tr><th>%{DATA:ServiceType_word}</th><td>%{DATA:ServiceType_id}</td></tr><tr><th>%{DATA:ComputeSite_word}</th><td>%{DATA:ComputeSite_id}</td></tr><tr><th>>%{DATA:Username_word}</th><td>%{DATA:Username_value}</td></tr><tr><th>%{DATA:Operation_word}</th><td>%{DATA:Operation_value}</td></tr><tr><th>%{DATA:Status_word}</th><td>%{DATA:Status_value}</td></tr><tr><th>%{DATA:SubStatus_word}</th><td>%{DATA:SubStatus_value</td></tr><tr><th>%{DATA:CreateTime_word}</th><td>%{TIMESTAMP_ISO8601}</td></tr><tr><th>%{DATA:StartTime_word}</th><td>%{TIMESTAMP_ISO8601}</td></tr><tr><th>%{DATA:EndTime_word}</th><td>%{TIMESTAMP_ISO8601}</td></tr><tr><th>%{DATA:UpdateTime_word}</th><td>%{TIMESTAMP_ISO8601}</td></tr><tr><th>%{DATA:JobInfo_word}</th><td>%{DATA:JobInfo_text}</td></tr><tr><th>%{DATA:RequestParameters_word}</th><td>%{DATA:RequestParameters_log}</tr><tr><th>%{DATA:SupplementalLogs_word}</th><td>%{DATA:SupplementalLogs_value}</td></tr><tr><th>%{DATA:Summary_word}</th><td><pre>%{DATA:Summary_log}</pre></td></tr></table>" }
    }
  }
}
# THIS IS THE OUTPUT CONFIGURATION
output {
  elasticsearch {
    hosts => ["localhost:9200"]
    id => "htmlLogs_output_ES" }
  stdout {
    codec => rubydebug }
}
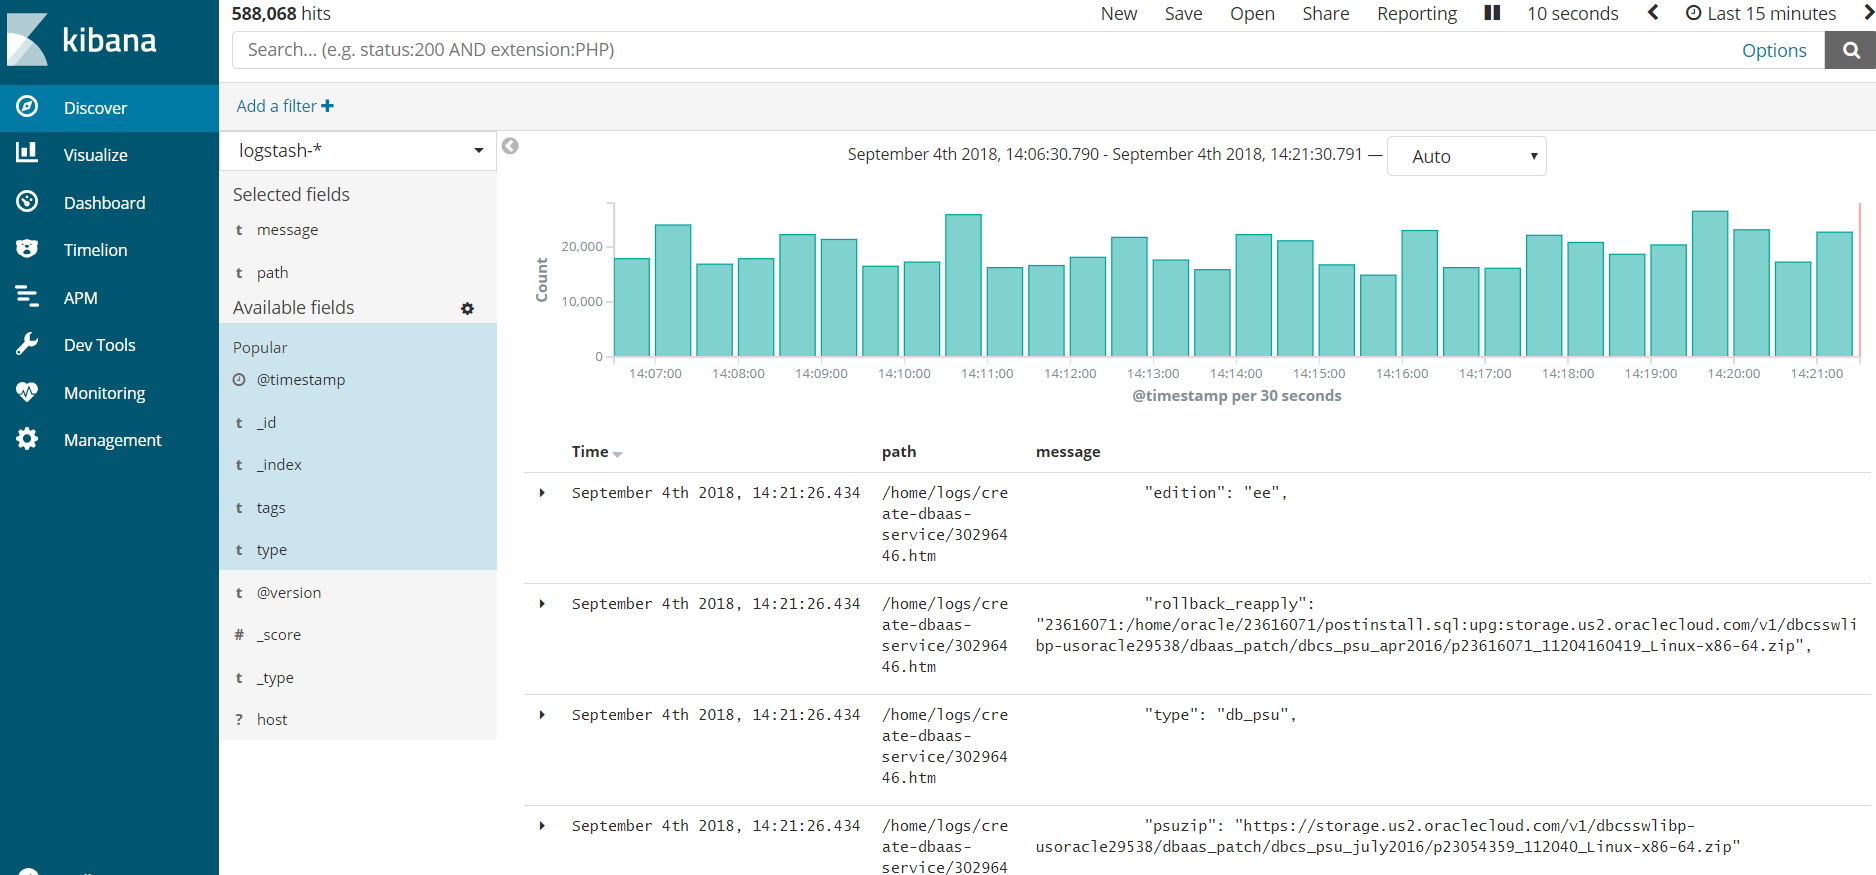
... but the GROK filtering section seems that is not defined correctly, because in Discovery section (Kibana), I am getting this output (here seems that all is fine, because the message section is showing info form the HTML log (that sound good))...
but I need to filter the data... and also the next image showing the tag: _grokparsefailure :

Could someone help me to know what is the issue with my file.conf (filter grok parse section)?
THANKS!!