HTTP Poller [API] input in Logstash - Does it support "Request_data" on top of "Headers"?

Hi everyone,

I am new to ELK and I am trying to pull JSON data from Palo Alto platform into Logstash for processing. Some info redacted as xxxx.

API DOCS: Get Alerts

Does Logstash support such http headers?

input {
  http_poller {
    urls => {
	  someAPIsystem => {
	    method => "POST"
	    url => "https://api-xxxxx.paloaltonetworks.com/public_api/v1/alerts/get_alerts_multi_events/"
	    headers => {
		    x-xdr-auth-id => "6". # this is a mandatory api id
		    Authorization => "xxxxx APIkey XXXX"
		    Content-Type => "application/json"
	    }
	  }
    }
    request_timeout => 30
    interval => 60
    codec => "json"
    metadata_target => "http_poller_metadata"
  }
}

output {
	elasticsearch {
		hosts => "elasticsearch:9200"
		user => "logstash_internal"
		password => "${LOGSTASH_INTERNAL_PASSWORD}"
		index => "ecs-logstash-getalerts"
	}
	file {
        path => "/usr/share/logstash/elogs/output/getalert_logs.txt"
    }
    stdout{
    	codec => rubydebug
    }
}

You have - which not allowed.

The given configuration is invalid. Reason: Expected one of [A-Za-z0-9_], [ \t\r\n], "#", "=>" at line 8

And it's not interval, it's schedule

input {
  http_poller {
    urls => {
	  someAPIsystem => {
	    method => "POST"
	    url => "https://api-xxxxx.paloaltonetworks.com/public_api/v1/alerts/get_alerts_multi_events/"
	    headers => {
		    xxdrauthid => "6"
		    Authorization => "xxxxx APIkey XXXX"
		    ContentType => "application/json"
	    }
	  }
    }
    request_timeout => 30
    schedule => { cron => "* * * * * UTC"}
    codec => "json"
    metadata_target => "http_poller_metadata"
  }
}

Hi Rios,

Thanks for the input.

No more errors in logstash and I managed to see the "one" record in the index populated in Kibana.

However, I still facing the 401 request error in logstash. ID and api key and settings are the same as in API Software called Postman. No issues with postman!

401: Unauthorized access. An issue occurred during authentication. This can indicate an incorrect key, id, or other invalid authentication parameters.

I was thinking if the authentication parameters which is the headers in logstash support Palo Alto requirement.

Appreciate if any other views on this!


Postman success with return code 200!

Are you using the same headers without the hyphens in Postman?
There is a better solution for the headers names, put under quotes it will support hyphens, check this
Also try to add ecs_compatibility => "disabled" ,

    codec => "json"
    ecs_compatibility => "disabled"
    metadata_target => "http_poller_metadata"
  }
}

Based on Palo Alto documents, I just need to put in the api_id and api_key. Based on the document above.

Error message I get from Logstash :frowning:

Error msg in Logstash! :frowning_face:

{"reply": {"err_code": 101, "err_msg": "Missing required params", "err_extra": "Missing required param request_data"}}

Updated .conf file below

input {
  http_poller {
    urls => {
		  ussite => {
		    method => "POST"
		    url => "https://api-XXXXX.xdr.us.paloaltonetworks.com/public_api/v1/alerts/get_alerts_multi_events/"
		    headers => {
			    "x-xdr-auth-id" => "7"
			    "Authorization" => "xxxxredactedxxxx"
			    "Content-Type" => "application/json"   #with or without this line also same error
		    }
		  }
    }
    tags => "us_site"
    request_timeout => 30
    schedule => {cron => "* * * * * UTC"}
    codec => "json"
    ecs_compatibility => "disabled" #with or without this line still same error
    metadata_target => "http_poller_metadata"
  }
}
filter{
    json{
        source => "message"
    }
}
output {
	elasticsearch {
		hosts => "elasticsearch:9200"
		user => "logstash_internal"
		password => "${LOGSTASH_INTERNAL_PASSWORD}"
		index => "ecs-logstash-alerts"
	}
	http {
        url => "http://localhost:9000"
        http_method => "post"
  }
	file {
        path => "/usr/share/logstash/elogs/output/getalert_logs.txt"
  }
  stdout{
    	codec => rubydebug
  }
}

request_data is missing in the JSON object. Check documentation

Thanks Rios. I didn't know about the "request_data" portion!
But does Logstash http poller support "request_data"?

Edited .conf file below:

input {
  http_poller {
    urls => {
		  ussite => {
		    method => "POST"
		    url => "https://apiXXXXX.xdr.us.paloaltonetworks.com/public_api/v1/alerts/get_alerts_multi_events/"
		    headers => {
			    "x-xdr-auth-id => "XX"
			    "Authorization" => "XXXXXX"
		    }
		    data => {
		    	"request_data" => "" # blank means retrieve all records. It should be a json object here
		    }
		  }
    }
    tags => "us_site"
    request_timeout => 30
    schedule => {cron => "* * * * * UTC"}
    codec => "json"
    metadata_target => "http_poller_metadata"
  }
}
filter{
    json{
        source => "message"
    }
}

Still getting a 500 internal server error (Missing required param request_data) reply :cry:
Suspect the request_data not pass in correctly

Tried this to pass in the request_data. Still getting the error (Missing required param request_data)

'''

input {
  http_poller {
    urls => {
		  ussite => {
		    method => "POST"
		    url => "https://apiXXXXX.xdr.us.paloaltonetworks.com/public_api/v1/alerts/get_alerts_multi_events/"
		    headers => {
			    "x-xdr-auth-id => "XX"
			    "Authorization" => "XXXXXX"
		    }
		    request_data => "{"request_data":{}}" # means return all results. Is this the correct format?
		    }
		  }
    }
    tags => "us_site"
    request_timeout => 30
    schedule => {cron => "* * * * * UTC"}
    codec => "json"
    metadata_target => "http_poller_metadata"
  }
}

'''

headers => {
			    "x-xdr-auth-id" => "xx"
			    "Authorization" => "xxxx"
		    }
data => "{ "request_data":{}}" #means return all result

Just giving it a try. Will this work with the http poller? :laughing: Still having the error (Missing required param request_data)

In python script, using "data" works though

 response = requests.request("POST", APIurl, headers=headers, data=payload)

Screenshot of Palo Alto requirement below.

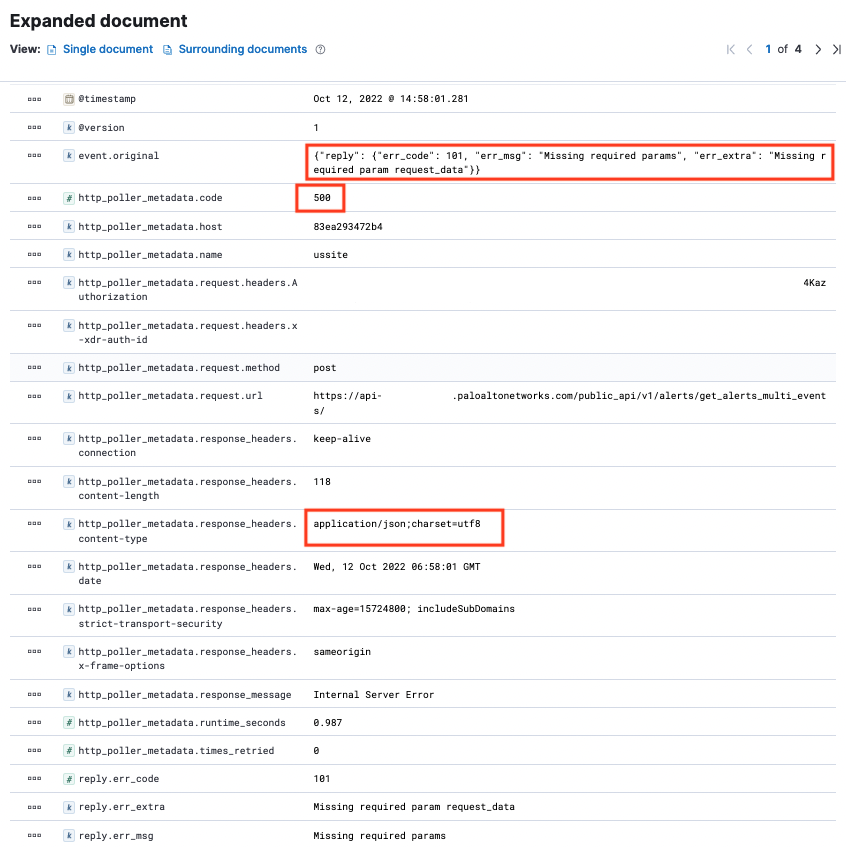
It requires "headers" and "request_data". Thanks to Rios for discovering this!
Question is does "http poller" support "request_data"?
Cannot seems to find any examples or documentation on this


Error message points to this line of code

data => "{"request_data": {}}"

Try with body:

input {
  http_poller {
    urls => {
		  ussite => {
		    method => "POST"
		    url => "https://apiXXXXX.xdr.us.paloaltonetworks.com/public_api/v1/alerts/get_alerts_multi_events/"
		    headers => {
			    "x-xdr-auth-id => "XX"
			    "Authorization" => "XXXXXX"
		    }
		    body=> '{ "request_data":{} }' 
		    }
		  }
    }
    tags => "us_site"
    request_timeout => 30
    schedule => {cron => "* * * * * UTC"}
    codec => "json"
    metadata_target => "http_poller_metadata"
  }
}

The values in urls can be either:

  • a string url (which will be issued as an HTTP GET).

  • a sub-hash containing many useful keys provided by the Manticore backend:

    • url: the String url
    • method: (optional) the HTTP method to use (defaults to GET)
    • user: (optional) the HTTP Basic Auth user. The user must be under an auth sub-hash for Manticore, but this plugin also accepts it either way.
    • password: (optional) the HTTP Basic Auth password. The password must be under an auth sub-hash for Manticore, but this plugin accepts it either way.
    • headers: a hash containing key-value pairs of headers.
    • body: a string (supported only on POST and PUT requests)
    • possibly other options mentioned in the Manticore docs. Note that Manticore options that are not explicitly documented above are not thoroughly tested and therefore liable to break in unexpected ways if we replace the backend.

Yea! The "body" with single quotes works!
But i still cannot get kibana to display the data.

.....
.....
		    body => '{ "request_data":{} }'
		  }
    }
    tags => "us_site"
    request_timeout => 30
    schedule => {cron => "* * * * * UTC"}
    codec => "json"
    metadata_target => "http_poller_metadata"
  }
}
filter{
    json{
        source => "message"
    }
}
output {
	elasticsearch {
		hosts => "elasticsearch:9200"
		user => "logstash_internal"
		password => "${LOGSTASH_INTERNAL_PASSWORD}"
		index => "ecs-logstash-xdrusalerts"
	}
	file {
        path => "/usr/share/logstash/elogs/output/getalert_logs.txt"
  }
  stdout{
    	codec => rubydebug
  }
}

troubleshooting now...
At least want to test and basic parse the json or greedydata into Elasticsearch before working on the filter portion.

Check does logstash_internal have rights on ecs-logstash-xdrusalerts index

I am able to see data after removed the "index =>ecs-logstash-xdrusalerts", reboot and used the default logstash index.

Q1: 13 char date should be "UNIX_MS"? What's the difference with "UNIX"?
Q2: I need to get the field "detection_timestamp" to fit into "@timestamp". Exploring the "target =>" option
Q3: The difference between Data stream and Indices. In this case of HTTP Poller API post request, I should be using "Data Stream"? If yes, how do I specify a target data Stream in logstash Output{}?

Next I need to work on parsing the json object nicely~

Need some guide how to parse the json object

Layer 1: All key events are inside alerts[0] to [4]. This first layer is "By host".
Screenshot 2022-10-13 at 1.11.29 PM

Layer 2: Those in red to put into ES fields. Box in green is another layer. This second layer is "By Alert"

This json object is grouped in the way shown above.

Objective is to get all "alerts" broken down into each object with its corresponding host found in Layer 1 and send to Elasticsearch.

There is no reason for a blockade to insert data in any index if you have proper rights.

UNIX time is epoch time. If you have readable, you have to convert with the date plugin.
Your time is 1665629477915 in milliseconds -10/13/2022, 4:51:17 AM, should use UNIX_MS

	date {
      match => [ "detection_timestamp", "yyyy-MM-dd HH:mm:ss" ] # change to your format
      target=> "@timestamp"
      timezone => "Europe/Berlin" # this is optional
	}

Data streams are more for logs or data in general which will not be updated - append-only. Here is a sample.

Need some guide how to parse the json object
You will access inside LS as [replay][alers][0] ...
Create fields as you wish inside LS with mutate add_field

  mutate { 
   add_field => { 
   "[alert][layer1]" => "%{[reply][alerts][0]}"
   "[alert][layer2][hostname]" => "%{hostname}" 
   }
  }

Fields which you do want, just delete
mutate { remove_field => ["resolution_comment", "mac"] }

1 Like

i was thinking to split the json first before mapping the fields. Reasons is there are many sub json objects nested. Is this correctly done?

filter{
		split { field => "[reply][alerts][0]" }
		split { field => "[reply][alerts][1]" }
		split { field => "[reply][alerts][2]" }
		split { field => "[reply][alerts][3]" }	
		split { field => "[reply][alerts][4]" }

}

Screenshot 2022-10-13 at 1.11.29 PM

Able to load into ES but having this tag error: _split_type_failure

Looks like the split function is critical to remove [0-4]

Oh my :cry:

Can you share the plain text response you get from your HTTP request?

It is pretty hard to understand what is your issue with all those screenshots, some of them are pretty hard to read, avoid sharing screenshots if your issue is not related to any visual feature of the stack.

From what I was able to get it seems that you make a request to some API and your response is a json where you have a field named reply.alerts which is an array.

It looks like that each element in this array is a different alert, if so, a simple split filter in the field reply.alerts would work as it would create one new document for each element in the array.

Something like this:

filter {
    split {
        field => "[reply][alerts]"
    }
}

But as I said, it is hard to understand what is the issue with all those screenshots, if you share an example of the result you are getting as a plain text using the preformatted button would be easier.