Hi @axw
Here it is
{
  "_index": "apm-7.15.0-span-000001",
  "_type": "_doc",
  "_id": "xcA9bH0B8rQ47_3ObHMi",
  "_version": 1,
  "_score": 1,
  "_source": {
    "parent": {
      "id": "63f3e2e7c2c62742"
    },
    "agent": {
      "name": "otlp",
      "version": "unknown"
    },
    "destination": {
      "address": "my.url.com",
      "port": 443
    },
    "processor": {
      "name": "transaction",
      "event": "span"
    },
    "url": {
      "original": "https://my.url.com/"
    },
    "labels": {
      "http_flavor": "1.1"
    },
    "observer": {
      "hostname": "ee32bebdb23e",
      "id": "ef9e88a6-7ae1-46e2-bfc3-70ef63b00606",
      "ephemeral_id": "a03808d2-83c3-4d5c-8ba4-75f0ca92d34c",
      "type": "apm-server",
      "version": "7.15.0",
      "version_major": 7
    },
    "trace": {
      "id": "8a78ca00f99ecc85d292f5c6fee5a6b2"
    },
    "@timestamp": "2021-11-29T15:08:22.444Z",
    "ecs": {
      "version": "1.11.0"
    },
    "service": {
      "name": "test-service"
    },
    "http": {
      "request": {
        "method": "POST"
      },
      "response": {
        "status_code": 200
      }
    },
    "event": {
      "outcome": "success"
    },
    "timestamp": {
      "us": 1638198502444966
    },
    "span": {
      "duration": {
        "us": 2
      },
      "subtype": "http",
      "destination": {
        "service": {
          "resource": "my.url.com:443",
          "name": "https://my.url.com",
          "type": "external"
        }
      },
      "name": "child",
      "http": {
        "method": "POST",
        "response": {
          "status_code": 200
        }
      },
      "http.url.original": "https://my.url.com/",
      "id": "84a6b6f38aa01f89",
      "type": "external"
    }
  },
  "fields": {
    "span.destination.service.type": [
      "external"
    ],
    "span.name": [
      "child"
    ],
    "span.http.method": [
      "POST"
    ],
    "destination.port": [
      443
    ],
    "span.http.response.status_code": [
      200
    ],
    "url.original.text": [
      "https://my.url.com/"
    ],
    "trace.id": [
      "8a78ca00f99ecc85d292f5c6fee5a6b2"
    ],
    "span.duration.us": [
      2
    ],
    "http.request.method": [
      "POST"
    ],
    "processor.event": [
      "span"
    ],
    "agent.name": [
      "otlp"
    ],
    "destination.address": [
      "my.url.com"
    ],
    "http.response.status_code": [
      200
    ],
    "event.outcome": [
      "success"
    ],
    "service.name": [
      "test-service"
    ],
    "processor.name": [
      "transaction"
    ],
    "span.subtype": [
      "http"
    ],
    "span.id": [
      "84a6b6f38aa01f89"
    ],
    "observer.version_major": [
      7
    ],
    "span.http.url.original": [
      "https://my.url.com/"
    ],
    "observer.hostname": [
      "ee32bebdb23e"
    ],
    "span.type": [
      "external"
    ],
    "observer.id": [
      "ef9e88a6-7ae1-46e2-bfc3-70ef63b00606"
    ],
    "timestamp.us": [
      1638198502444966
    ],
    "url.original": [
      "https://my.url.com/"
    ],
    "@timestamp": [
      "2021-11-29T15:08:22.444Z"
    ],
    "observer.ephemeral_id": [
      "a03808d2-83c3-4d5c-8ba4-75f0ca92d34c"
    ],
    "observer.version": [
      "7.15.0"
    ],
    "ecs.version": [
      "1.11.0"
    ],
    "observer.type": [
      "apm-server"
    ],
    "parent.id": [
      "63f3e2e7c2c62742"
    ],
    "labels.http_flavor": [
      "1.1"
    ],
    "agent.version": [
      "unknown"
    ],
    "span.destination.service.name": [
      "https://my.url.com"
    ],
    "span.destination.service.resource": [
      "my.url.com:443"
    ]
  }
}
I ran the snippet you paste above over a new APM server (using docker) and the result was the same 
Root:
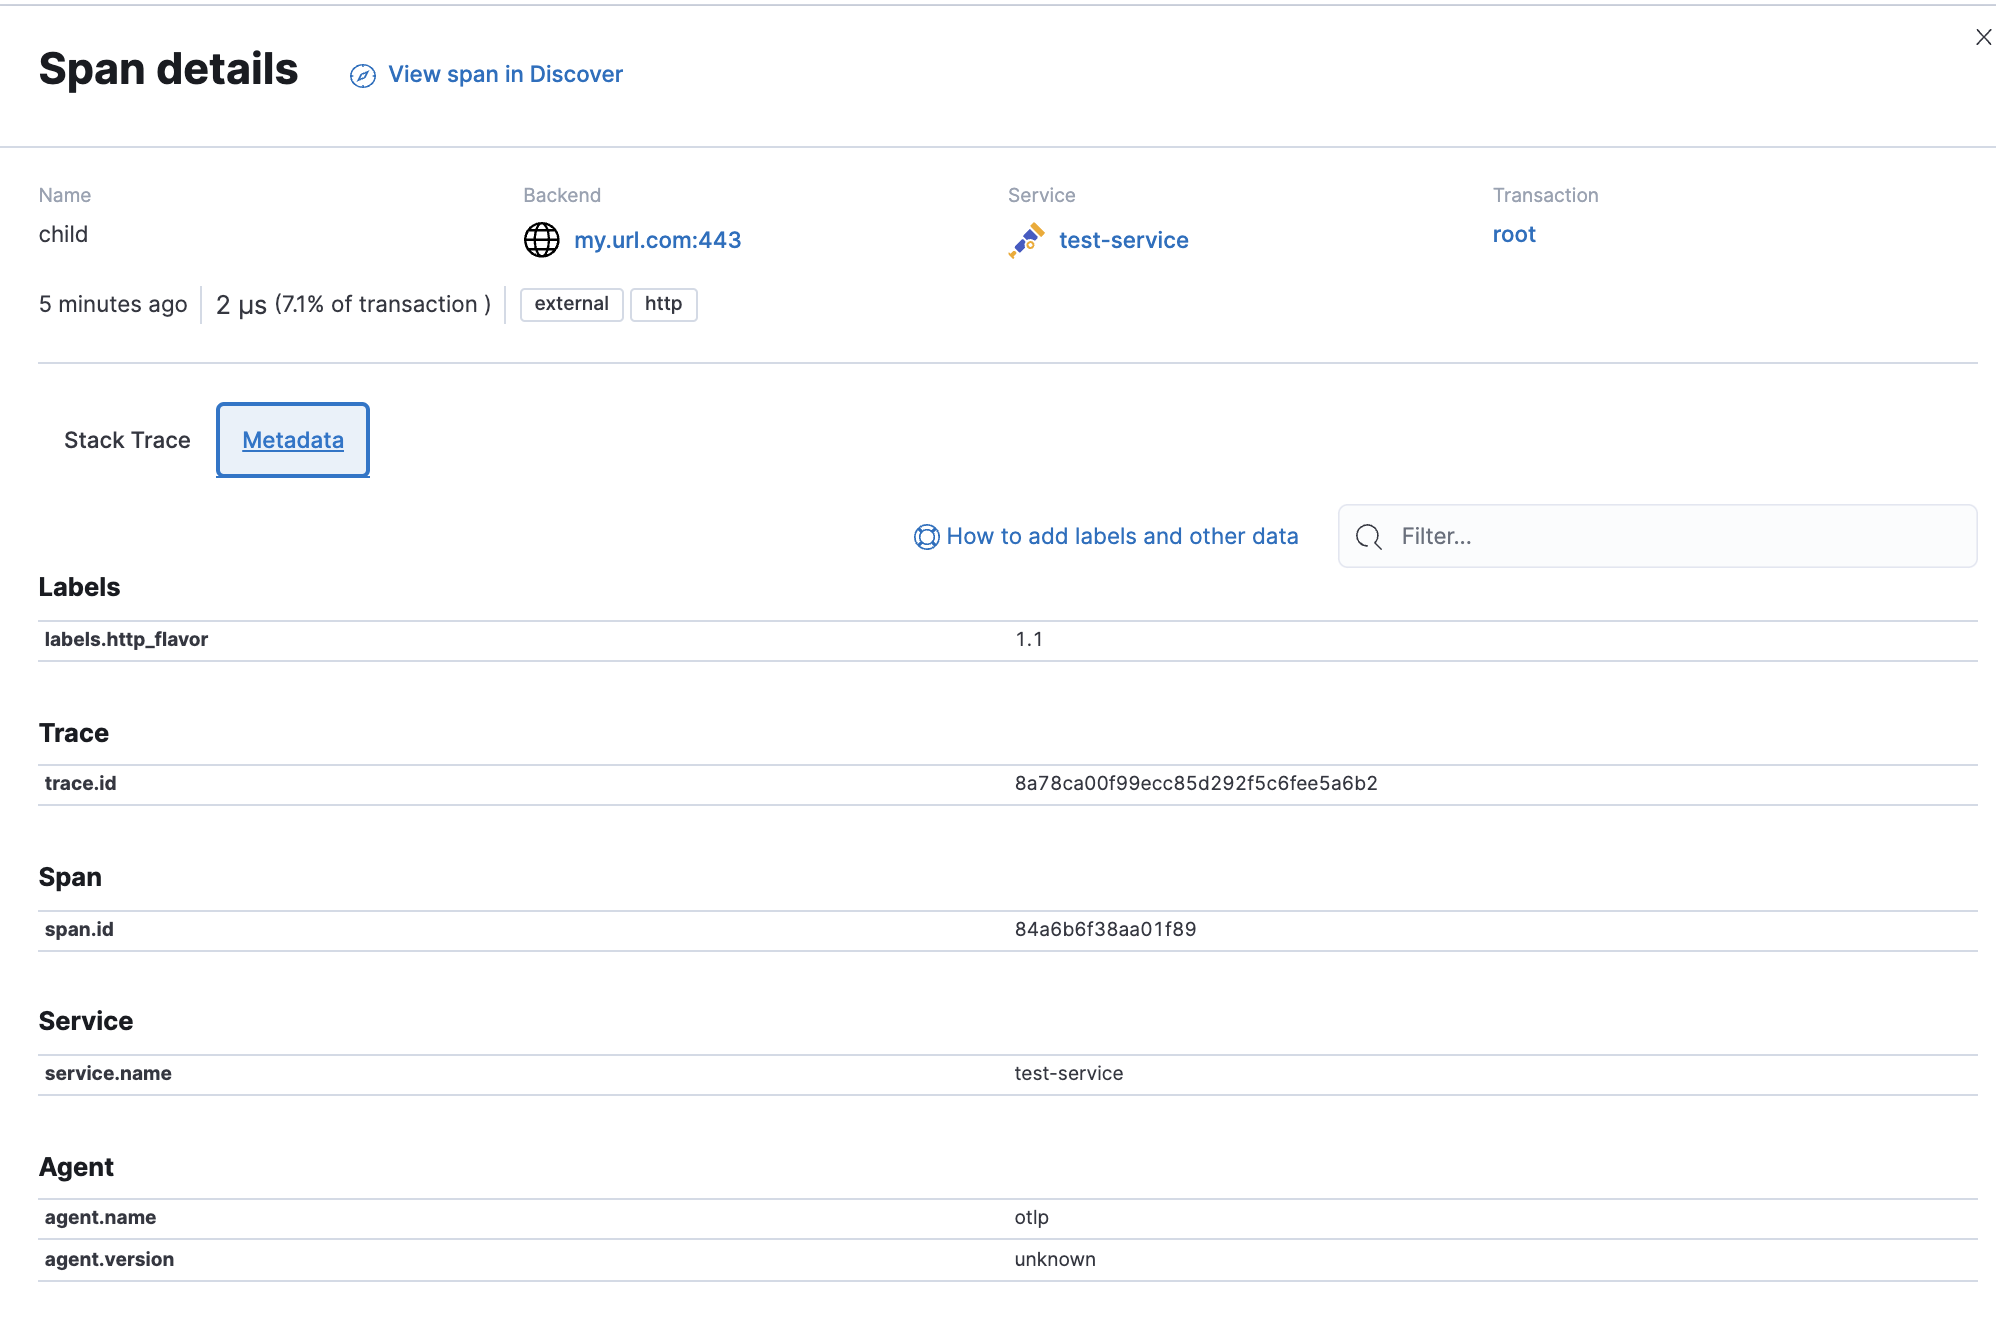
Child: