Indexing JSON files from a local directory to elastic

Hello,

I wish to configure my Logstash pipline so it will index JSON files from a local directory.
Of course, I already went through relevant topics and found no satisfying solution for my case, for instance, this issue here:

is very similar to mine.

My pipline config file looks as follows:

input
{
file
{
codec => multiline
{
pattern => '^{'
negate => true
what => previous
}
path => ["c:/work/UXMresults/.json"]
start_position => "beginning"
sincedb_path => "/dev/null"
exclude => "
.gz"
}
}

filter
{

}
output {
elasticsearch {
hosts => [ "localhost:9200" ]
index => "yeti"
}

}

where a typical json file I want to index looks like this:

{
"testParams":
{
"testingDevice":"UXM",
"visaAddress": "TCPIP0::172.25.150.216::5125::SOCKET",
"testCase":"",
"testDescription":"",
"stopCondition":
{
"numOfSubFrames":""
},
"rfBoxConfiguration":"Yeti_2x8"

    },
"preScriptUxmParams":
    {
        "antConfig":"D2U1",
        "schedulerMode":"",
        "bw":"BW20",
        "duplex":"tdd",
        "band":"41",
        "periodicCsi":"",
        "aperiodicCsi":"",
        "mcs":"15",
        "tm":"",
        "tddConfig":"",
        "ssfConfig":"",
        "numOfCw":"",
        "awgn":"",
        "channel":"",
        "allocationType":"",
        "cfi":"",
        "numOfLayers":"",
        "rsPower":""
    },
"runScriptUxmParams":
    {
                        "macPadding":""
    },
"results":
    {
  	"dl":
  		{
  		"throughput":
  			{
  				"max":"164",
  				"avarage":"50"
  			},
  		"BLER":"3.2"
  		},
  	"ul":
  		{
  		"throughput":
  			{
  				"max":"10",
  				"avarage":"10"
  			},
  		"BLER":"0"
  		}		
    }                        

}

Logstash seems to accept this pipline config when I run it

nevertheless,
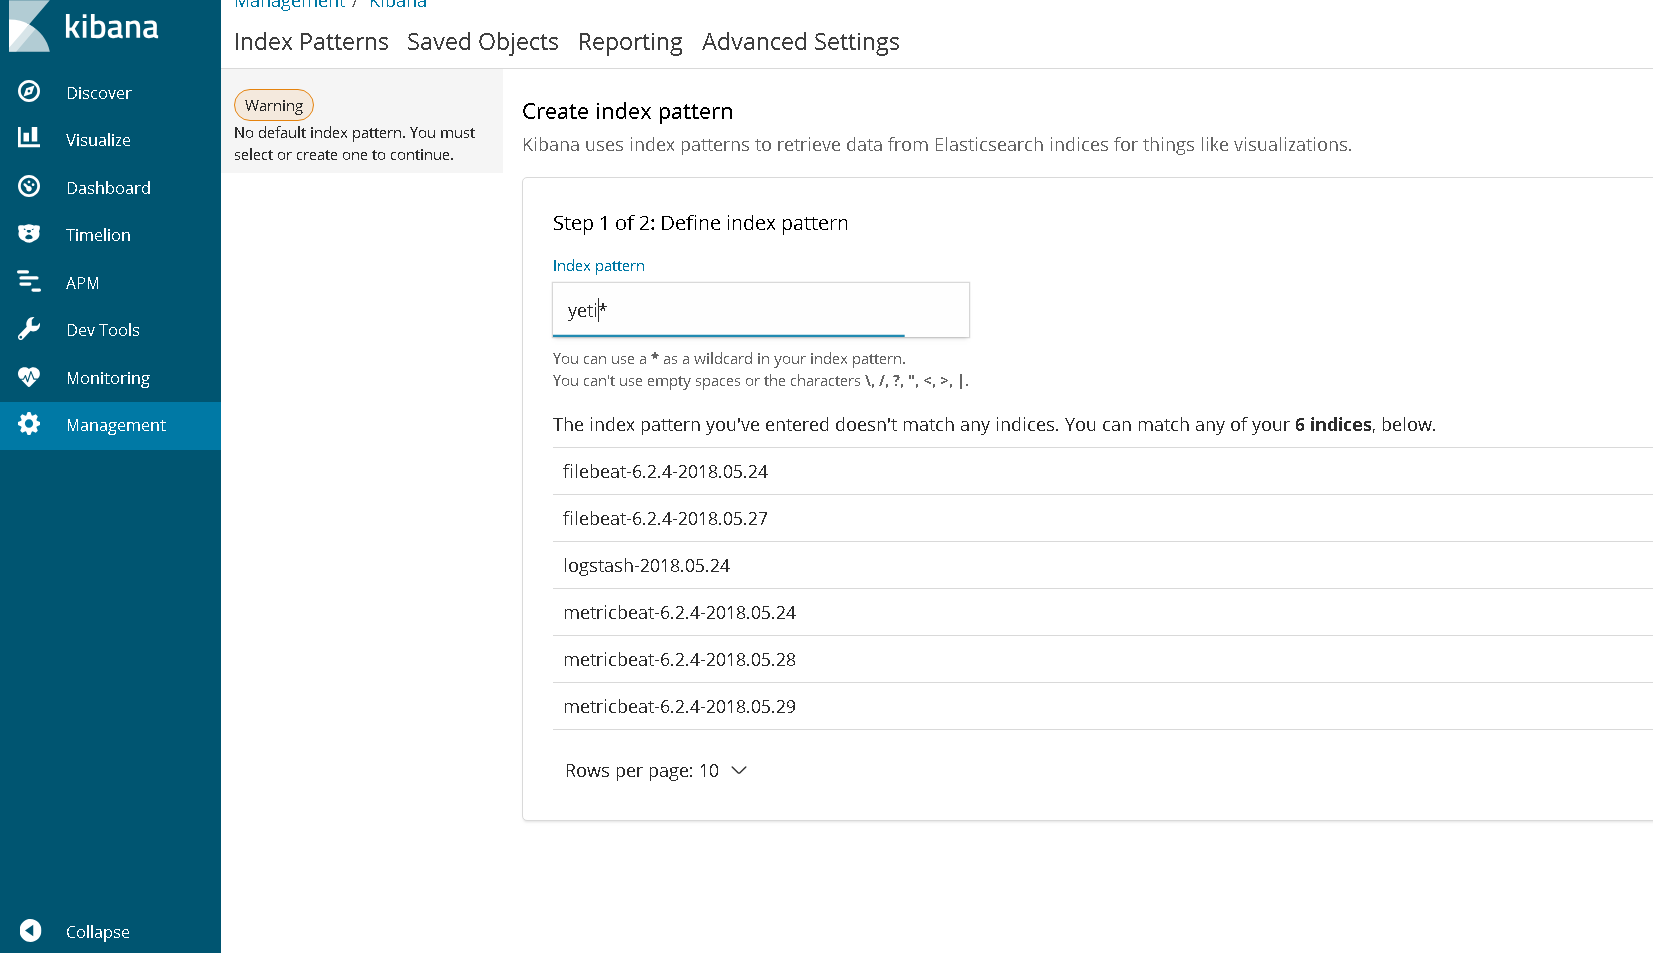
I cant find any trace to the index I gave in the config file("yeti") on Kibana>>Discover

Help will be mush appreciated
Yaniv

sincedb_path => "/dev/null"

On Windows use "nul", not "/dev/null".

Still no luck

input
{
file
{

    path => ["C:\work\UXMresults\test_ex2.json"]
    start_position => "beginning"
    sincedb_path => "nul"
    exclude => "*.gz"
    codec => json
}

}

filter
{
}

output {
elasticsearch {
hosts => [ "localhost:9200" ]
index => "yeti"
}

}

Logstash is ok with the config file

But Kibana doesn't seem to recognize the given index

Besides using the console, is there another sanity check I can do to test the ability of kibana to identify new indexed documents?

Temporarily replace the elasticsearch output with a stdout { codec => rubydebug } output to just dump all events being read. Are you getting anything then?

You can't use the json codec like this - it is expecting one flat JSON doc per line and multiline is a real pain

Pretty printed JSON files are a problem.

if the files are content complete, i.e. their size is fixed, then there is a side effect hack one can use but you will need the latest logstash file input v4.1.2.

This version (4.1.2) has a read mode. In this mode the end-of-file is significant and we use this to flush any content that accumulates in the delimiter search buffer.

How do we read the whole file into the buffer without breaking it up into lines? We set an impossible delimiter that can never be found in the content. For example, unicode U+00B6 Pilcrow Sign '¶' or U+00A7 Section Sign '§' or a combination of the two. This has the effect of creating a document with the whole file content in the message field, newlines and all - obviously, the file should not be too big (you don't want OOM). You can use the JSON filter to parse the message field into the document.
Example:

input {
  file {
    path => "/Users/guy/tmp/testing/logs/sample.json"
    sincedb_path => "/dev/null"
    delimiter => "§¶¶§"
    mode => "read"
    file_completed_action => "log"
    file_completed_log_path => "/Users/guy/tmp/testing/logs/test-json-ml-hack-completed.txt"
  }
}

filter {
  json {
    source => "[message]"
    remove_field => ["[message]"]
  }
}

output {
  stdout {
    codec => rubydebug
  }
}

The JSON file content looks like this:

{"widget": {
    "debug": "on",
    "window": {
        "title": "Sample Konfabulator Widget",
        "name": "main_window",
        "width": 500,
        "height": 500
    },
    "image": {
        "src": "Images/Sun.png",
        "name": "sun1",
        "hOffset": 250,
        "vOffset": 250,
        "alignment": "center"
    },
    "text": {
        "data": "Click Here",
        "size": 36,
        "style": "bold",
        "name": "text1",
        "hOffset": 250,
        "vOffset": 100,
        "alignment": "center",
        "onMouseUp": "sun1.opacity = (sun1.opacity / 100) * 90;"
    }
}}

And the resultant Logstash docs (event):

{
      "@version" => "1",
    "@timestamp" => 2018-05-30T14:26:43.308Z,
          "host" => "Elastics-MacBook-Pro.local",
          "path" => "/Users/guy/tmp/testing/logs/sample.json",
        "widget" => {
         "debug" => "on",
         "image" => {
                 "name" => "sun1",
              "vOffset" => 250,
                  "src" => "Images/Sun.png",
            "alignment" => "center",
              "hOffset" => 250
        },
        "window" => {
            "height" => 500,
              "name" => "main_window",
             "title" => "Sample Konfabulator Widget",
             "width" => 500
        },
          "text" => {
                 "name" => "text1",
            "alignment" => "center",
                 "size" => 36,
            "onMouseUp" => "sun1.opacity = (sun1.opacity / 100) * 90;",
                 "data" => "Click Here",
              "vOffset" => 100,
                "style" => "bold",
              "hOffset" => 250
        }
    }
}

This topic was automatically closed 28 days after the last reply. New replies are no longer allowed.