Is it possible to apply aggregate filter on cef logs. Would you please check my conf file if there is something wrong. it should aggregating when name and sourceAddress are common and increase field aggregatedEvents by 1 every time. below are the conf file:
input
{
udp
{
port => "516"
type => "Forcepoint"
codec => "cef"
}
}
It's possible, yes. But if I am reading it correctly you add aggregatedEvents to the map, and then expire it 30 seconds later. You don't push the map as an event on timeout, and you have no end-task.
What do you want to do with this aggregatedEvents counter and when do you want to do it?
I copied the aggregate section and its working and aggregating. However, currently I am geeting fields only task_id and aggregatedEvents. How I get the fields name and source address separated.
and again thank you for your full support
Another question:
I need to aggrgate bytesIn and bytesOut fields which are integer fields. I mean if there is three logs with byteIn (500,400,600) the final byteIn aggrgated field will be 1500. How I will do this in code section of aggrgate filter
If you want to ignore everything after the first 50 then wrap some of the += lines with a test for map['aggregatedEvents'] being <= 50. If you want to push an event for the first 50 and start a new aggregation I am not sure that you can do that.
I am doing now geoip for the destination IP as below. How can I map field geoip.location to use it for map visualize. Would you advise me and thank you again for your full support
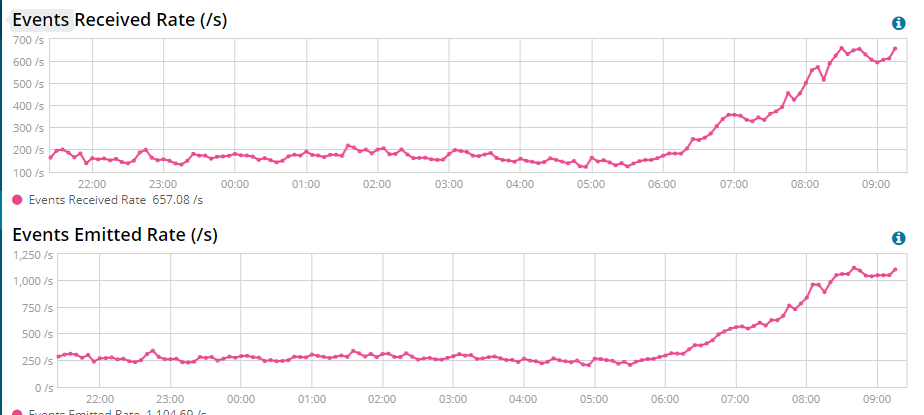
I am seeing the Emitted events is more than the Received Events.
I think aggregation goal is to decrease the Emitted events in comparsion to the Recevived Events.
I checked the aggregation its working fine. Need your advise.
If you have monitoring enabled and drill into a pipeline you will see that inputs emit events, and outputs receive them. To me this is counter-intuitive, I think a pipeline should receive events, process them, and then emit them, but that's not how those terms are used in logstash.
Apache, Apache Lucene, Apache Hadoop, Hadoop, HDFS and the yellow elephant
logo are trademarks of the
Apache Software Foundation
in the United States and/or other countries.