I'm on Windows 10.
I'm building a pipeline with Filebeat / Logstash / Elasticsearch / Kibana. Each one of them is at the latest version (downloaded thie previous week).
I'm trying to ship a simple log file (ndjson format). It works perfectly from the Kibana interface (machine learning tab). So I guess the format is correct.
But it doesn't work via Logstash directly.
Here a line from my log file:
{"time":"2022-02-16T15:49:53.000Z", "path":"page0", "status":2}
All the tools are with default configuration.
I made few changes in the filebeat.yml file:
I uncomment the logstash output
Set the input path with the same path logstash use to search for the log (see config below).
That will persist the in-memory sincedb across restarts in a file called NULL in logstash's working directory. If you do not want the sincedb persisted then use "NUL".
If that does not fix things, then set --log.level trace and look for messages from the filewatch module.
And I got a lot of logs. I read them all and did not see something wrong, here are few lines (I removed the timestamp and ids to make it shorter):
Firts the path
# This is the correct path
[DEBUG][logstash.inputs.file     ] config LogStash::Inputs::File/@start_position = "beginning"

[DEBUG][logstash.inputs.file     ] config LogStash::Inputs::File/@path = ["C:/Users/bianca6/Documents/test_env/my_logs/logs_from_loki/*.log"]

[logstash.inputs.file     ] config LogStash::Inputs::File/@id = "<very long id>"

[logstash.inputs.file     ] config LogStash::Inputs::File/@sincedb_path = "NUL"
Then the file
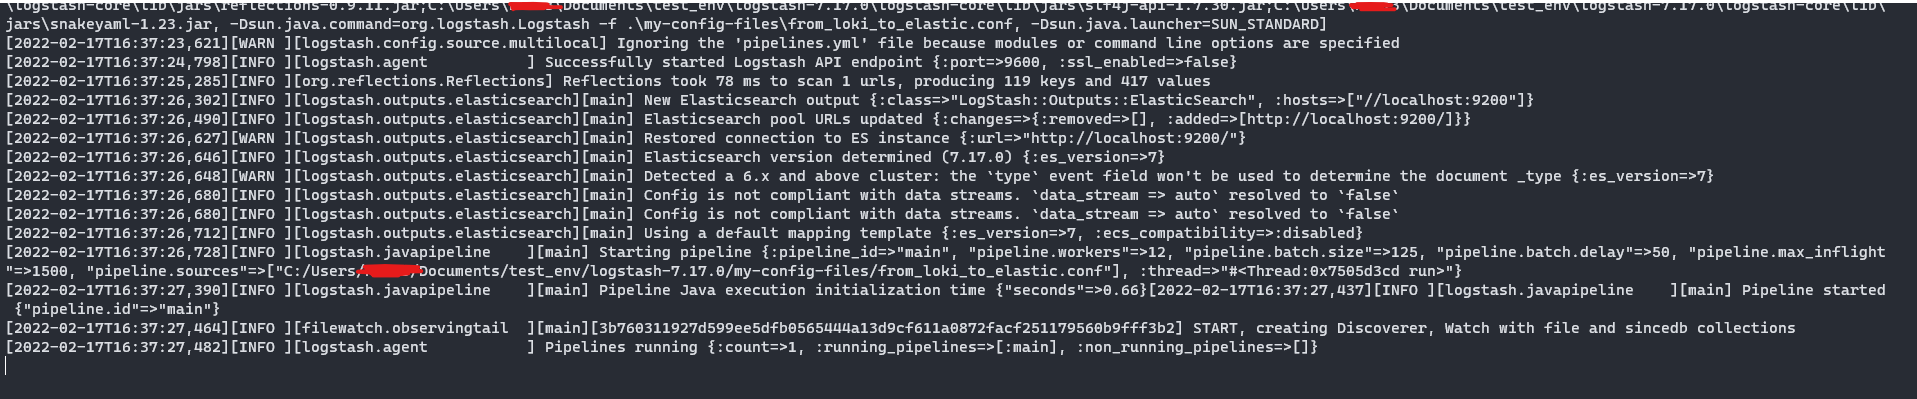
[INFO ][filewatch.observingtail  ][main][<very long id>] START, creating Discoverer, Watch with file and sincedb collections

/* It found one file, and I have one */
[TRACE][filewatch.discoverer     ][main][<very long id>] discover_files {:count=>1}

/* This is the correct filename */
[TRACE][filewatch.discoverer     ][main][<very long id>] handling: {:new_discovery=>true, :watched_file=>"<FileWatch::WatchedFile: @filename='1645027880.log', @state=:watched, @recent_states=[:watched], @bytes_read=0, @bytes_unread=0, current_size=64000, last_stat_size=64000, file_open?=false, @initial=true, sincedb_key='1222633604-121961-2293760 0 0'>"}
Finaly, an endless loop like this
[DEBUG][logstash.instrument.periodicpoller.jvm] collector name {:name=>"scavenge"}

[DEBUG][logstash.instrument.periodicpoller.jvm] collector name {:name=>"global"}

[filewatch.tailmode.processor][main][<very long id>] process_closed

[filewatch.tailmode.processor][main][<very long id>] process_ignored

[TRACE][filewatch.tailmode.processor][main][<very long id>] process_delayed_delete

[TRACE][filewatch.tailmode.processor][main][<very long id>] process_restat_for_watched_and_active

[TRACE][filewatch.tailmode.processor][main][<very long id>] process_rotation_in_progress

[TRACE][filewatch.tailmode.processor][main][<very long id>] process_watched

[TRACE][filewatch.tailmode.processor][main][<very long id>] process_active

[TRACE][filewatch.tailmode.processor][main][<very long id>] process_active no change {:path=>"1645027880.log"}

[TRACE][filewatch.tailmode.processor][main][<very long id>] process_closed
I see the same steps again and again, but I think this is just my pipeline running and waiting new files? Or is it an error?
Final result is, I still don't have any logs on Elas/Kib...
OK, so it found the file. It says the file size is 64000, it has not read anything from the file (@bytes_read=0), and does not think it needs to read anything from the file (@bytes_unread=0). That would suggest either start_position => "end", or sincedb_path != "NUL", neither of which is true. I cannot explain it.
Is there any log which can tell me something as "I'm Logstash, I sent to Elasticsearch this and that" and "I'm Elasticsearch, I just received from Logstash this and that"?
Apache, Apache Lucene, Apache Hadoop, Hadoop, HDFS and the yellow elephant
logo are trademarks of the
Apache Software Foundation
in the United States and/or other countries.