Hello !
I'm a newbie on logstash and trying to decode cisco telemetry data in json format. My code in logstash are the following:
filter {
if [type] == "xjson" {
json {
source => "message"
}
mutate {
remove_field => [ "message" ]
}
date {
match => [ "[Rows][Timestamp]", "UNIX_MS", "UNIX"]
}
date {
match => [ "[Telemetry][msg_timestamp]", "UNIX_MS", "UNIX" ]
}
}
}
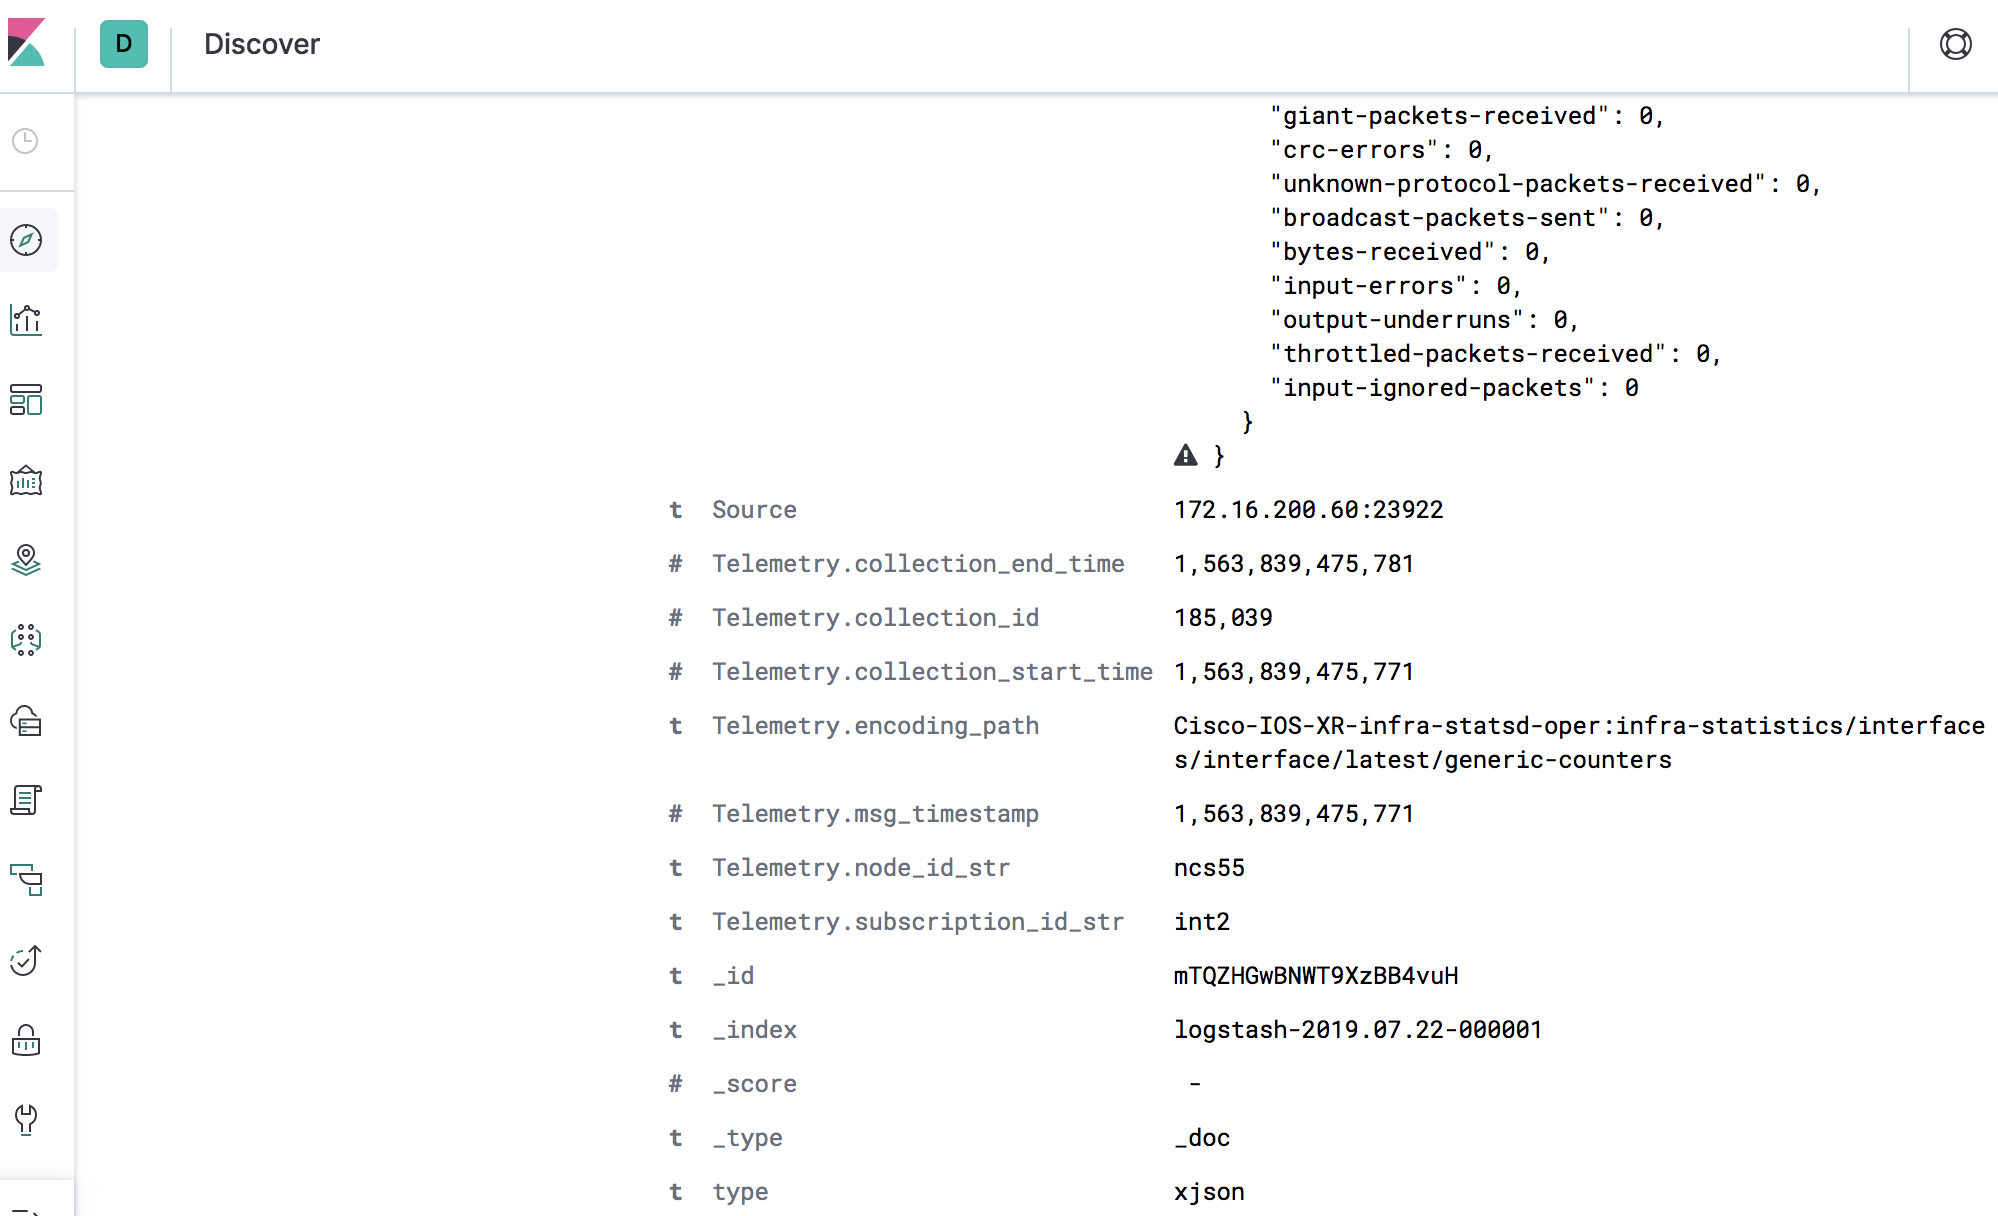
The json data are the following:
{
"_index": "logstash-2019.07.21-000001",
"_type": "_doc",
"_id": "5fRfFGwBWU64Pkw1pznQ",
"_version": 1,
"_score": null,
"_source": {
"@timestamp": "2019-07-21T11:51:48.864Z",
"type": "xjson",
"@version": "1",
"Telemetry": {
"collection_id": 124647,
"msg_timestamp": 1563709831176,
"collection_end_time": 1563709831185,
"node_id_str": "ncs55",
"subscription_id_str": "int2",
"collection_start_time": 1563709831176,
"encoding_path": "Cisco-IOS-XR-infra-statsd-oper:infra-statistics/interfaces/interface/latest/generic-counters"
},
"Rows": [
{
"Content": {
"last-discontinuity-time": 1563431358,
"packets-received": 0,
"runt-packets-received": 0,
"seconds-since-packet-sent": 4294967295,
"input-queue-drops": 0,
"multicast-packets-sent": 0,
"seconds-since-packet-received": 4294967295,
"bytes-sent": 0,
"packets-sent": 0,
"input-aborts": 0,
"seconds-since-last-clear-counters": 0,
"parity-packets-received": 0,
"output-underruns": 0,
"availability-flag": 0,
"throttled-packets-received": 0,
"crc-errors": 0,
"framing-errors-received": 0,
"broadcast-packets-received": 0,
"output-buffers-swapped-out": 0,
"applique": 0,
"broadcast-packets-sent": 0,
"input-drops": 0,
"output-drops": 0,
"resets": 0,
"input-ignored-packets": 0,
"output-buffer-failures": 0,
"output-queue-drops": 0,
"giant-packets-received": 0,
"input-errors": 0,
"last-data-time": 1563709820,
"multicast-packets-received": 0,
"output-errors": 0,
"input-overruns": 0,
"carrier-transitions": 0,
"unknown-protocol-packets-received": 0,
"bytes-received": 0
},
"Timestamp": 1563709831182,
"Keys": {
"interface-name": "Null0"
}
},
{
"Content": {
"last-discontinuity-time": 1563431445,
"packets-received": 0,
"runt-packets-received": 0,
"seconds-since-packet-sent": 4294967295,
"input-queue-drops": 0,
"multicast-packets-sent": 0,
"seconds-since-packet-received": 4294967295,
"bytes-sent": 0,
"packets-sent": 0,
"input-aborts": 0,
"seconds-since-last-clear-counters": 0,
"parity-packets-received": 0,
"output-underruns": 0,
"availability-flag": 0,
"throttled-packets-received": 0,
"crc-errors": 0,
"framing-errors-received": 0,
"broadcast-packets-received": 0,
"output-buffers-swapped-out": 0,
"applique": 0,
"broadcast-packets-sent": 0,
"input-drops": 0,
"output-drops": 0,
"resets": 0,
"input-ignored-packets": 0,
"output-buffer-failures": 0,
"output-queue-drops": 0,
"giant-packets-received": 0,
"input-errors": 0,
"last-data-time": 1563709791,
"multicast-packets-received": 0,
"output-errors": 0,
"input-overruns": 0,
"carrier-transitions": 0,
"unknown-protocol-packets-received": 0,
"bytes-received": 0
},
"Timestamp": 1563709831182,
"Keys": {
"interface-name": "HundredGigE0/0/1/2"
}
},
{
"Content": {
"last-discontinuity-time": 1563431445,
"packets-received": 0,
"runt-packets-received": 0,
"seconds-since-packet-sent": 4294967295,
"input-queue-drops": 0,
"multicast-packets-sent": 0,
"seconds-since-packet-received": 4294967295,
"bytes-sent": 0,
"packets-sent": 0,
"input-aborts": 0,
"seconds-since-last-clear-counters": 0,
"parity-packets-received": 0,
"output-underruns": 0,
"availability-flag": 0,
"throttled-packets-received": 0,
"crc-errors": 0,
"framing-errors-received": 0,
"broadcast-packets-received": 0,
"output-buffers-swapped-out": 0,
"applique": 0,
"broadcast-packets-sent": 0,
"input-drops": 0,
"output-drops": 0,
"resets": 0,
"input-ignored-packets": 0,
"output-buffer-failures": 0,
"output-queue-drops": 0,
"giant-packets-received": 0,
"input-errors": 0,
"last-data-time": 1563709791,
"multicast-packets-received": 0,
"output-errors": 0,
"input-overruns": 0,
"carrier-transitions": 0,
"unknown-protocol-packets-received": 0,
"bytes-received": 0
},
"Timestamp": 1563709831182,
"Keys": {
"interface-name": "HundredGigE0/0/1/1"
}
}
],
"Source": "172.16.200.60:23549"
},
"fields": {
"@timestamp": [
"2019-07-21T11:51:48.864Z"
]
},
"sort": [
1563709908864
]
}
Every time, the Rows.Timestamp and Telemetry.msg_timestamp always matched to number.
Could someone guide me how to match this data?
Thank you in advance!
Tosamon L.