Hello,
I run filebeat and filebeat run each line from log to logstash, and I have each grok for each line message. But why grok not sending the second data (different field) to Elasticsearch..
This bellow my configuration :
logstash-fileter.conf :
input { stdin { } }

filter {
		if [message] =~ "SSH login" {
			grok {
				match => { "message" => "%{SYSLOGTIMESTAMP:lfd.time} %{HOSTNAME:lfd.host} %{WORD:lfd.app}\[%{NUMBER:lfd.pid}\]\: \*%{DATA:lfd.act}\* from %{IP:lfd.ip} into the %{WORD:lfd.user} account using %{DATA:lfd.method} \- %{WORD:lfd.status}" }
      			}
		} else if [message] =~ "Blocked" {
			grok {
				match => { "message" => "%{SYSLOGTIMESTAMP:lfd.time} %{HOSTNAME:lfd.host} %{WORD:lfd.app}\[%{NUMBER:lfd.pid}\]: \(%{WORD:lfd.act.app}\) %{DATA:lfd.act.desc} from %{IP:lfd.ip} %{DATA:lfd.path.source}: %{DATA:lfd.reason} - %{DATA:lfd.act.blocked} \[%{DATA:lfd.rule}\]" }
			}
		} else {
			drop {}
		}
}

output {
  elasticsearch { hosts => ["112.78.176.26:9200"] }
  stdout { codec => rubydebug }
}
mylog :
May 27 23:31:01 web1-cpn lfd[3023828]: (cpanel) Failed cPanel login from 185.94.188.23 (NL/Netherlands/-): 60 in the last 60 secs - Blocked in csf [LF_CPANEL]
[root@server1 ~]# cat lfd.log | grep Blocked -A3
May 27 23:31:01 web1-cpn lfd[3023828]: (cpanel) Failed cPanel login from 185.94.188.23 (NL/Netherlands/-): 60 in the last 60 secs - Blocked in csf [LF_CPANEL]
May 27 23:31:50 web1-cpn lfd[2324927]: SSH login from 117.102.98.28 into the root account using publickey authentication - ignored
May 27 23:31:50 web1-cpn lfd[2324927]: SSH login from 117.102.98.28 into the root account using publickey authentication - ignored
please advice,, why there is not sending the second data to elasticsearch?
thanks,
What does the stdout { codec => rubydebug } output produce, i.e. what are you getting? What did you expect to get instead?
I set two output,, first output for elasticsearch and the the second for I debuging output.
This is for the output debug working well :
The stdin plugin is now waiting for input:
May 27 23:31:01 web1-cpn lfd[3023828]: (cpanel) Failed cPanel login from 185.94.188.23 (NL/Netherlands/-): 60 in the last 60 secs - *Blocked in csf* [LF_CPANEL]
{
           "lfd.time" => "May 27 23:31:01",
            "lfd.pid" => "3023828",
         "lfd.reason" => "60 in the last 60 secs",
            "lfd.app" => "lfd",
        "lfd.act.app" => "cpanel",
           "@version" => "1",
            "message" => "May 27 23:31:01 web1-cpn lfd[3023828]: (cpanel) Failed cPanel login from 185.94.188.23 (NL/Netherlands/-): 60 in the last 60 secs - *Blocked in csf* [LF_CPANEL]",
    "lfd.path.source" => "(NL/Netherlands/-)",
    "lfd.act.blocked" => "*Blocked in csf*",
           "lfd.rule" => "LF_CPANEL",
         "@timestamp" => 2018-05-31T08:01:56.831Z,
             "lfd.ip" => "185.94.188.23",
               "host" => "azizpunya.com",
           "lfd.host" => "web1-cpn",
       "lfd.act.desc" => "Failed cPanel login"
}
May 27 23:31:50 web1-cpn lfd[2324927]: *SSH login* from 117.102.98.28 into the root account using publickey authentication - ignored
{
      "lfd.user" => "root",
      "lfd.time" => "May 27 23:31:50",
       "lfd.pid" => "2324927",
    "lfd.method" => "publickey authentication",
       "lfd.app" => "lfd",
      "@version" => "1",
       "message" => "May 27 23:31:50 web1-cpn lfd[2324927]: *SSH login* from 117.102.98.28 into the root account using publickey authentication - ignored",
       "lfd.act" => "SSH login",
    "@timestamp" => 2018-05-31T08:02:14.530Z,
        "lfd.ip" => "117.102.98.28",
          "host" => "azizpunya.com",
      "lfd.host" => "web1-cpn",
    "lfd.status" => "ignored"
}
but in elasticsearch/kibana, its only show frist line parsed ?
Logstash sends the same events to all outputs.
What do the events look like in Kibana? Copy/paste from the JSON tab of the Discover panel.
Hi Back,
The following output results in kibana like this:
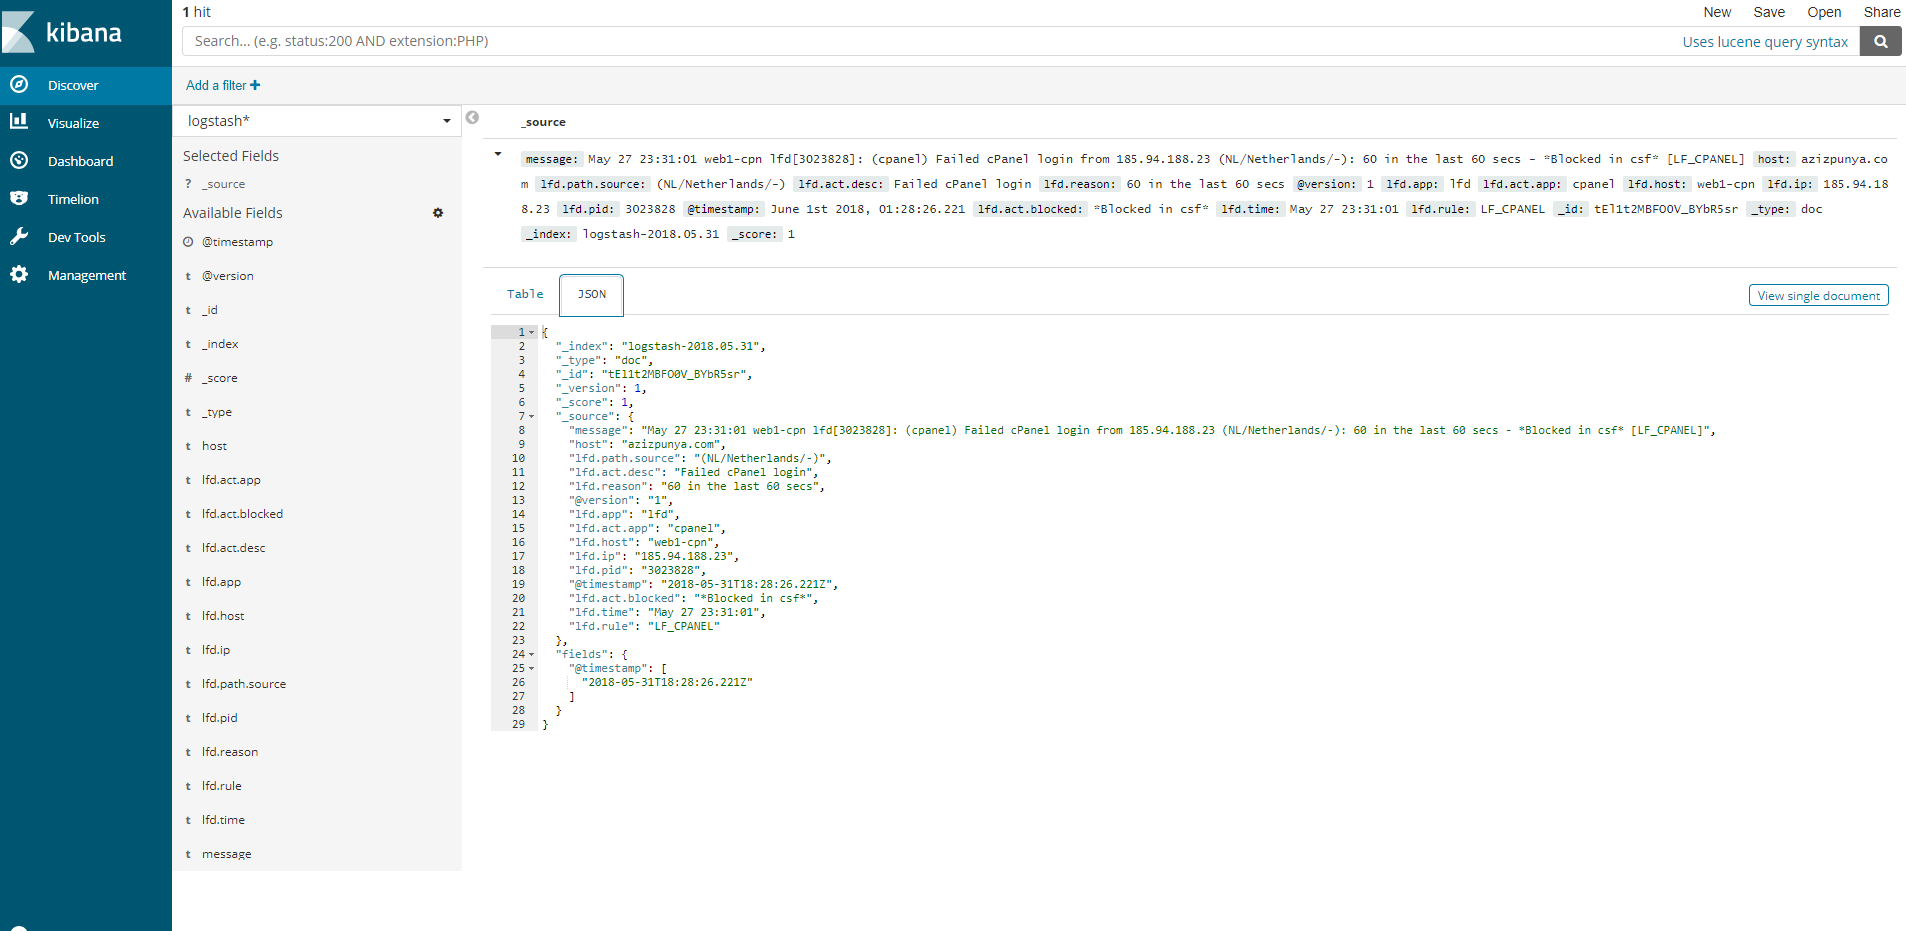
It only show the first line/message data has been parsed to kibana? and the second line/message not shown?
whether it can be due to differences in the field that I give in each groks?
please help the solution for this issue?
hello,
anyone can help this issue?