Logstash Filebeat module Configuration - No data has been received from this module yet

Hi,

I have been trying to configure Logstash Filebeat module. However I received message "No data has been received from this module yet".

I have installed Logstash. The following log from console:


Sending Logstash logs to /u01/logstash/logstash-7.8.0/logs which is now configured via log4j2.properties
[2020-07-29T11:35:56,584][WARN ][logstash.config.source.multilocal] Ignoring the 'pipelines.yml' file because modules or command line options are specified
[2020-07-29T11:35:57,621][INFO ][logstash.runner ] Starting Logstash {"logstash.version"=>"7.8.0", "jruby.version"=>"jruby 9.2.11.1 (2.5.7) 2020-03-25 b1f55b1a40 OpenJDK 64-Bit Server VM 25.242-b08 on 1.8.0_242-b08 +indy +jit [linux-x86_64]"}
[2020-07-29T11:36:13,058][INFO ][org.reflections.Reflections] Reflections took 386 ms to scan 1 urls, producing 21 keys and 41 values
[2020-07-29T11:36:25,315][INFO ][logstash.outputs.elasticsearch][main] Elasticsearch pool URLs updated {:changes=>{:removed=>, :added=>[http://elastic:xxxxxx@ip:9200/]}}
[2020-07-29T11:36:27,234][WARN ][logstash.outputs.elasticsearch][main] Restored connection to ES instance {:url=>"http://elastic:xxxxxx@ip:9200/"}
[2020-07-29T11:36:27,730][INFO ][logstash.outputs.elasticsearch][main] ES Output version determined {:es_version=>7}
[2020-07-29T11:36:27,798][WARN ][logstash.outputs.elasticsearch][main] Detected a 6.x and above cluster: the type event field won't be used to determine the document _type {:es_version=>7}
[2020-07-29T11:36:28,303][INFO ][logstash.outputs.elasticsearch][main] New Elasticsearch output {:class=>"LogStash::Outputs::ElasticSearch", :hosts=>["//ip:9200"]}
[2020-07-29T11:36:28,627][INFO ][logstash.filters.geoip ][main] Using geoip database {:path=>"/u01/logstash/logstash-7.8.0/vendor/bundle/jruby/2.5.0/gems/logstash-filter-geoip-6.0.3-java/vendor/GeoLite2-City.mmdb"}
[2020-07-29T11:36:29,185][INFO ][logstash.outputs.elasticsearch][main] Using default mapping template
[2020-07-29T11:36:29,952][INFO ][logstash.outputs.elasticsearch][main] Attempting to install template {:manage_template=>{"index_patterns"=>"logstash-", "version"=>60001, "settings"=>{"index.refresh_interval"=>"5s", "number_of_shards"=>1, "index.lifecycle.name"=>"logstash-policy", "index.lifecycle.rollover_alias"=>"logstash"}, "mappings"=>{"dynamic_templates"=>[{"message_field"=>{"path_match"=>"message", "match_mapping_type"=>"string", "mapping"=>{"type"=>"text", "norms"=>false}}}, {"string_fields"=>{"match"=>"", "match_mapping_type"=>"string", "mapping"=>{"type"=>"text", "norms"=>false, "fields"=>{"keyword"=>{"type"=>"keyword", "ignore_above"=>256}}}}}], "properties"=>{"@timestamp"=>{"type"=>"date"}, "@version"=>{"type"=>"keyword"}, "geoip"=>{"dynamic"=>true, "properties"=>{"ip"=>{"type"=>"ip"}, "location"=>{"type"=>"geo_point"}, "latitude"=>{"type"=>"half_float"}, "longitude"=>{"type"=>"half_float"}}}}}}}
[2020-07-29T11:36:31,307][INFO ][logstash.javapipeline ][main] Starting pipeline {:pipeline_id=>"main", "pipeline.workers"=>1, "pipeline.batch.size"=>125, "pipeline.batch.delay"=>50, "pipeline.max_inflight"=>125, "pipeline.sources"=>["/u01/logstash/logstash-7.8.0/logconfig-v2.conf"], :thread=>"#<Thread:0x76af06d2 run>"}
[2020-07-29T11:36:39,353][INFO ][logstash.inputs.file ][main] No sincedb_path set, generating one based on the "path" setting {:sincedb_path=>"/u01/logstash/logstash-7.8.0/data/plugins/inputs/file/.sincedb_1c5ec98ac07a49055e612055de3d47da", :path=>["/u01/logstash/logstash-7.8.0/logs"]}
[2020-07-29T11:36:39,634][INFO ][logstash.inputs.beats ][main] Beats inputs: Starting input listener {:address=>"0.0.0.0:5044"}
[2020-07-29T11:36:39,985][INFO ][logstash.javapipeline ][main] Pipeline started {"pipeline.id"=>"main"}
[2020-07-29T11:36:41,030][INFO ][filewatch.observingtail ][main][39906785d3dba41157d0c9f4a80f330a3334999d5ceeae3d9a282f5b268b4227] START, creating Discoverer, Watch with file and sincedb collections
[2020-07-29T11:36:41,185][INFO ][logstash.agent ] Pipelines running {:count=>1, :running_pipelines=>[:main], :non_running_pipelines=>}
[2020-07-29T11:36:41,816][INFO ][org.logstash.beats.Server][main][c33a0efb6914b4a748d572e16a9c14e89c4ad6afef127dacfc7d7fa44ceaa8e2] Starting server on port: 5044
[2020-07-29T11:36:45,985][INFO ][logstash.agent ] Successfully started Logstash API endpoint {:port=>9600}


I have installed filebeat and the following log from console:


2020-07-29T11:54:24.608+0800 INFO instance/beat.go:647 Home path: [/u01/filebeat/filebeat-7.8.0-linux-x86_64] Config path: [/u01/filebeat/filebeat-7.8.0-linux-x86_64] Data path: [/u01/filebeat/filebeat-7.8.0-linux-x86_64/data] Logs path: [/u01/filebeat/filebeat-7.8.0-linux-x86_64/logs]
2020-07-29T11:54:24.608+0800 INFO instance/beat.go:655 Beat ID: 3884be0a-ca89-4fbd-ac71-94efd8420180
2020-07-29T11:54:27.611+0800 INFO [add_cloud_metadata] add_cloud_metadata/add_cloud_metadata.go:89 add_cloud_metadata: hosting provider type not detected.
2020-07-29T11:54:27.612+0800 INFO [seccomp] seccomp/seccomp.go:124 Syscall filter successfully installed
2020-07-29T11:54:27.612+0800 INFO [beat] instance/beat.go:983 Beat info {"system_info": {"beat": {"path": {"config": "/u01/filebeat/filebeat-7.8.0-linux-x86_64", "data": "/u01/filebeat/filebeat-7.8.0-linux-x86_64/data", "home": "/u01/filebeat/filebeat-7.8.0-linux-x86_64", "logs": "/u01/filebeat/filebeat-7.8.0-linux-x86_64/logs"}, "type": "filebeat", "uuid": "3884be0a-ca89-4fbd-ac71-94efd8420180"}}}
2020-07-29T11:54:27.612+0800 INFO [beat] instance/beat.go:992 Build info {"system_info": {"build": {"commit": "f79387d32717d79f689d94fda1ec80b2cf285d30", "libbeat": "7.8.0", "time": "2020-06-14T18:15:37.000Z", "version": "7.8.0"}}}
2020-07-29T11:54:27.612+0800 INFO [beat] instance/beat.go:995 Go runtime info {"system_info": {"go": {"os":"linux","arch":"amd64","max_procs":1,"version":"go1.13.10"}}}
2020-07-29T11:54:27.613+0800 INFO [beat] instance/beat.go:999 Host info {"system_info": {"host": {"architecture":"x86_64","boot_time":"2020-07-29T10:17:36+08:00","containerized":false,"name":"localhost.localdomain","ip":["127.0.0.1/8","::1/128","ip/24","fe80::a00:27ff:fef1:be56/64","10.0.0.5/8","fe80::a00:27ff:fe85:e7d4/64","ip/24"],"kernel_version":"4.14.35-1902.11.3.el7uek.x86_64","mac":["08:00:27:f1:be:56","08:00:27:85:e7:d4","52:54:00:43:f2:99","52:54:00:43:f2:99"],"os":{"family":"","platform":"ol","name":"Oracle Linux Server","version":"7.7","major":7,"minor":7,"patch":0},"timezone":"+08","timezone_offset_sec":28800,"id":"c53dd0074710bd4e8fc8d0354ca04621"}}}
2020-07-29T11:54:27.614+0800 INFO [beat] instance/beat.go:1028 Process info {"system_info": {"process": {"capabilities": {"inheritable":null,"permitted":["chown","dac_override","dac_read_search","fowner","fsetid","kill","setgid","setuid","setpcap","linux_immutable","net_bind_service","net_broadcast","net_admin","net_raw","ipc_lock","ipc_owner","sys_module","sys_rawio","sys_chroot","sys_ptrace","sys_pacct","sys_admin","sys_boot","sys_nice","sys_resource","sys_time","sys_tty_config","mknod","lease","audit_write","audit_control","setfcap","mac_override","mac_admin","syslog","wake_alarm","block_suspend","audit_read"],"effective":["chown","dac_override","dac_read_search","fowner","fsetid","kill","setgid","setuid","setpcap","linux_immutable","net_bind_service","net_broadcast","net_admin","net_raw","ipc_lock","ipc_owner","sys_module","sys_rawio","sys_chroot","sys_ptrace","sys_pacct","sys_admin","sys_boot","sys_nice","sys_resource","sys_time","sys_tty_config","mknod","lease","audit_write","audit_control","setfcap","mac_override","mac_admin","syslog","wake_alarm","block_suspend","audit_read"],"bounding":["chown","dac_override","dac_read_search","fowner","fsetid","kill","setgid","setuid","setpcap","linux_immutable","net_bind_service","net_broadcast","net_admin","net_raw","ipc_lock","ipc_owner","sys_module","sys_rawio","sys_chroot","sys_ptrace","sys_pacct","sys_admin","sys_boot","sys_nice","sys_resource","sys_time","sys_tty_config","mknod","lease","audit_write","audit_control","setfcap","mac_override","mac_admin","syslog","wake_alarm","block_suspend","audit_read"],"ambient":null}, "cwd": "/u01/filebeat/filebeat-7.8.0-linux-x86_64", "exe": "/u01/filebeat/filebeat-7.8.0-linux-x86_64/filebeat", "name": "filebeat", "pid": 4256, "ppid": 3025, "seccomp": {"mode":"filter","no_new_privs":true}, "start_time": "2020-07-29T11:54:23.640+0800"}}}
2020-07-29T11:54:27.614+0800 INFO instance/beat.go:310 Setup Beat: filebeat; Version: 7.8.0
2020-07-29T11:54:27.614+0800 INFO [index-management] idxmgmt/std.go:183 Set output.elasticsearch.index to 'filebeat-7.8.0' as ILM is enabled.
2020-07-29T11:54:27.615+0800 INFO eslegclient/connection.go:97 elasticsearch url: http://ip:9200
2020-07-29T11:54:27.615+0800 INFO [publisher] pipeline/module.go:113 Beat name: localhost.localdomain
2020-07-29T11:54:27.617+0800 INFO kibana/client.go:118 Kibana url: http://ip:5601
2020-07-29T11:54:27.618+0800 INFO [monitoring] log/log.go:118 Starting metrics logging every 30s
2020-07-29T11:54:28.538+0800 INFO kibana/client.go:118 Kibana url: http://ip:5601
2020-07-29T11:55:57.620+0800 INFO [monitoring] log/log.go:145 Non-zero metrics in the last 30s {"monitoring": {"metrics": {"beat":{"cpu":{"system":{"ticks":240,"time":{"ms":76}},"total":{"ticks":1690,"time":{"ms":273},"value":1690},"user":{"ticks":1450,"time":{"ms":197}}},"handles":{"limit":{"hard":65536,"soft":65536},"open":18},"info":{"ephemeral_id":"b51ce56d-6580-48d7-8bc1-78a936c23b3d","uptime":{"ms":93061}},"memstats":{"gc_next":15427008,"memory_alloc":8812392,"memory_total":128212928},"runtime":{"goroutines":168}},"filebeat":{"events":{"active":11,"added":25,"done":14},"harvester":{"files":{"82931d40-7cac-4415-a501-d4463f4306d7":{"last_event_published_time":"2020-07-29T11:55:49.712Z","last_event_timestamp":"2020-07-29T11:55:44.708Z","name":"/var/log/mysqld.log","read_offset":2166331,"size":2166026,"start_time":"2020-07-29T11:55:37.704Z"}},"open_files":1,"running":1,"started":1}},"libbeat":{"config":{"module":{"running":0},"reloads":1,"scans":1},"output":{"events":{"acked":2,"batches":2,"total":2}},"pipeline":{"clients":13,"events":{"active":0,"filtered":12,"published":2,"retry":1,"total":14},"queue":{"acked":2}}},"registrar":{"states":{"current":11,"update":14},"writes":{"success":14,"total":14}},"system":{"load":{"1":0.38,"15":0.79,"5":0.4,"norm":{"1":0.38,"15":0.79,"5":0.4}}}}}}


I have done as mentioned in filebeat.yml.

output.elasticsearch:
hosts: ["ip:9200"]
username: "elastic"
password: "password"
setup.kibana:
host: "ip:5601"
username: "elastic"
password: "password"


Am I missing anything in my configuration ? Anyone, please guide.

Thanks,
Grace
Can you please format the above messages using code-block etc? Are you sending data from file-beat to logstash?

please paste your entire file-beat.yml (as the above just shows the output section and not the input section)

Also post the details of your logstash conf to see how you are inputting from filebeat

Hi Kin,

The logstash Filebeat module parses debug and slow logs created by Logstash itself. I am following the logstash Filebeat module configuration step to configure the module.


Here is the filebeat.yml


============================== Filebeat inputs ===============================

filebeat.inputs:

Each - is an input. Most options can be set at the input level, so

you can use different inputs for various configurations.

Below are the input specific configurations.

  • type: log

    Change to true to enable this input configuration.

    enabled: false

    Paths that should be crawled and fetched. Glob based paths.

    paths:

    • /var/log/*.log
      #- c:\programdata\elasticsearch\logs*

    Exclude lines. A list of regular expressions to match. It drops the lines that are

    matching any regular expression from the list.

    #exclude_lines: ['^DBG']

    Include lines. A list of regular expressions to match. It exports the lines that are

    matching any regular expression from the list.

    #include_lines: ['^ERR', '^WARN']

    Exclude files. A list of regular expressions to match. Filebeat drops the files that

    are matching any regular expression from the list. By default, no files are dropped.

    #exclude_files: ['.gz$']

    Optional additional fields. These fields can be freely picked

    to add additional information to the crawled log files for filtering

    #fields:

    level: debug

    review: 1

    Multiline options

    Multiline can be used for log messages spanning multiple lines. This is common

    for Java Stack Traces or C-Line Continuation

    The regexp Pattern that has to be matched. The example pattern matches all lines starting with [

    #multiline.pattern: ^[

    Defines if the pattern set under pattern should be negated or not. Default is false.

    #multiline.negate: false

    Match can be set to "after" or "before". It is used to define if lines should be append to a pattern

    that was (not) matched before or after or as long as a pattern is not matched based on negate.

    Note: After is the equivalent to previous and before is the equivalent to to next in Logstash

    #multiline.match: after

============================== Filebeat modules ==============================

filebeat.config.modules:

Glob pattern for configuration loading

path: ${path.config}/modules.d/*.yml

Set to true to enable config reloading

reload.enabled: false

Period on which files under path should be checked for changes

#reload.period: 10s

======================= Elasticsearch template setting =======================

setup.template.settings:
index.number_of_shards: 1
#index.codec: best_compression
_source.enabled: false

================================== General ===================================

The name of the shipper that publishes the network data. It can be used to group

all the transactions sent by a single shipper in the web interface.

#name:

The tags of the shipper are included in their own field with each

transaction published.

#tags: ["service-X", "web-tier"]

Optional fields that you can specify to add additional information to the

output.

#fields:

env: staging

================================= Dashboards =================================

These settings control loading the sample dashboards to the Kibana index. Loading

the dashboards is disabled by default and can be enabled either by setting the

options here or by using the setup command.

setup.dashboards.enabled: true

The URL from where to download the dashboards archive. By default this URL

has a value which is computed based on the Beat name and version. For released

versions, this URL points to the dashboard archive on the artifacts.elastic.co

website.

#setup.dashboards.url:

=================================== Kibana ===================================

Starting with Beats version 6.0.0, the dashboards are loaded via the Kibana API.

This requires a Kibana endpoint configuration.

setup.kibana:

Kibana Host

Scheme and port can be left out and will be set to the default (http and 5601)

In case you specify and additional path, the scheme is required: http://localhost:5601/path

IPv6 addresses should always be defined as: https://[2001:db8::1]:5601

host: "ip:5601"
username: "elastic"
password: "password"

Kibana Space ID

ID of the Kibana Space into which the dashboards should be loaded. By default,

the Default Space will be used.

#space.id:

=============================== Elastic Cloud ================================

These settings simplify using Filebeat with the Elastic Cloud (https://cloud.elastic.co/).

The cloud.id setting overwrites the output.elasticsearch.hosts and

setup.kibana.host options.

You can find the cloud.id in the Elastic Cloud web UI.

#cloud.id:

The cloud.auth setting overwrites the output.elasticsearch.username and

output.elasticsearch.password settings. The format is <user>:<pass>.

#cloud.auth:

================================== Outputs ===================================

Configure what output to use when sending the data collected by the beat.

---------------------------- Elasticsearch Output ----------------------------

output.elasticsearch:

Array of hosts to connect to.

hosts: ["ip:9200"]

Protocol - either http (default) or https.

#protocol: "https"

Authentication credentials - either API key or username/password.

#api_key: "id:api_key"
username: "elastic"
password: "password"

------------------------------ Logstash Output -------------------------------

#output.logstash:

The Logstash hosts

#hosts: ["localhost:5044"]
#hosts: ["ip:5044"]

Optional SSL. By default is off.

List of root certificates for HTTPS server verifications

#ssl.certificate_authorities: ["/etc/pki/root/ca.pem"]

Certificate for SSL client authentication

#ssl.certificate: "/etc/pki/client/cert.pem"

Client Certificate Key

#ssl.key: "/etc/pki/client/cert.key"

================================= Processors =================================

Configure processors to enhance or manipulate events generated by the beat.

processors:

  • add_host_metadata: ~
  • add_cloud_metadata: ~
  • add_docker_metadata: ~
  • add_kubernetes_metadata: ~

================================== Logging ===================================

Sets log level. The default log level is info.

Available log levels are: error, warning, info, debug

#logging.level: debug

At debug level, you can selectively enable logging only for some components.

To enable all selectors use ["*"]. Examples of other selectors are "beat",

"publish", "service".

#logging.selectors: ["*"]

============================= X-Pack Monitoring ==============================

Filebeat can export internal metrics to a central Elasticsearch monitoring

cluster. This requires xpack monitoring to be enabled in Elasticsearch. The

reporting is disabled by default.

Set to true to enable the monitoring reporter.

#monitoring.enabled: false

Sets the UUID of the Elasticsearch cluster under which monitoring data for this

Filebeat instance will appear in the Stack Monitoring UI. If output.elasticsearch

is enabled, the UUID is derived from the Elasticsearch cluster referenced by output.elasticsearch.

#monitoring.cluster_uuid:

Uncomment to send the metrics to Elasticsearch. Most settings from the

Elasticsearch output are accepted here as well.

Note that the settings should point to your Elasticsearch monitoring cluster.

Any setting that is not set is automatically inherited from the Elasticsearch

output configuration, so if you have the Elasticsearch output configured such

that it is pointing to your Elasticsearch monitoring cluster, you can simply

uncomment the following line.

#monitoring.elasticsearch:

================================= Migration ==================================

This allows to enable 6.7 migration aliases

#migration.6_to_7.enabled: true


Here is the logstash config file:


input
{
#here we have used file plugin of logstash, specify what file we want to ingest
file {
#location of log file
path => "/u01/logstash/logstash-7.8.0/logs"
type => "logs"
start_position => "beginning"
}
beats {
port => 5044
}
}
#multiple pulgins are used in this filter stage
filter
{
#grok plugin regular expression matcher, and we have used COMBINEDAPACHELOG here
#you can use different pattern from this link https://github.com/elastic/logstash/blob/v1.4.2/patterns/grok-patterns
grok{
match => {
"message" => "%{COMBINEDAPACHELOG}"
}
}
#mutate convert data types
mutate{
convert => { "bytes" => "integer" }
}
#date plugin format dates
date {
match => [ "timestamp", "dd/MMM/YYYY:HH:mm:ss Z" ]
locale => en
remove_field => "timestamp"
}
#geoip filter gets client ip from request
geoip {
source => "clientip"
}
}

output
{
#standard output on console
stdout {
codec => rubydebug { metadata => true }
}
#output to elasticsearch hosts
elasticsearch {
hosts => ["ip:9200"]
user => "elastic"
password => "password"
}

}

its quite hard to read your configs as it is pasted as header markdown. (Please use the code snippet)

But from what I can see you are doing it not correctly. What you are doing above is

  • filebeats is trying to send to elasticsearch directly
  • logstash is also looking for the physical location of file

What you ideally have to do in above case is

read the file -> filebeats -> logstash -> elasticsearch

So the pseudo code should be

# filebeat config
- type: log
  paths:
    - "somefile"
  tags: ["sometags"]

# Output this to logstash
output
output.logstash:
  hosts: ["somehost:5000"]

Now in logstash

#Collect from filebeat (not the physical file)
- pipeline.id: my_custom_pipeline
  config.string: |
    input {
      beats {
        port => "5000"
      }
    }
    output {
          pipeline { send_to => some_pipeline_or_directly_to_elasticSearch }
    }

PS: This is not the entire-code by pseudo code

If you don't any manipulation in logstash, you could send the filebeat directly to elasticsearch

Hi Kin,

A logstash index is created but still "No data has been received from this module yet".
I have done the following :


filebeat.xml


  • type: log
    enabled: true
    paths:
    • /var/log/*.log

tags: ["service-X", "web-tier"]

output.logstash:
hosts: ["ip:5044"]


logstash config.
Example from https://www.bmc.com/blogs/elasticsearch-logs-beats-logstash/.
without the pipeline. Logstash failed to start with pipeline.


input {
beats {
port => 5044
host => "0.0.0.0"
}
}

filter {
grok {
match => [ "message" , "%{COMBINEDAPACHELOG}+%{GREEDYDATA:extra_fields}"]
overwrite => [ "message" ]
}
mutate {
convert => ["response", "integer"]
convert => ["bytes", "integer"]
convert => ["responsetime", "float"]
}
geoip {
source => "clientip"
target => "geoip"
add_tag => [ "nginx-geoip" ]
}
date {
match => [ "timestamp" , "dd/MMM/YYYY:HH:mm:ss Z" ]
remove_field => [ "timestamp" ]
}
useragent {
source => "agent"
}
}

output {
elasticsearch {
hosts => ["ip:9200"]
user => "elastic"
password => "password"
index => "logstash-%{+YYYY.MM.dd}"
}
'# pipeline { send_to => ip:9200 }'
stdout { codec => rubydebug }
}

ok. My approach will be to do baby steps

  1. configure filebeat
  2. send to logstash and print-it out onto console to see if it reached logstash
  3. if yes, then put the filters and then again print to console
  4. if all good, then try sending to elasticsearch & then create index pattern

so my step2 would be

# logstash
input {
    beats {
      port => 5044
    }
}

# just output to logstash console
output {
    stdout {
        codec => rubydebug
    }
}

Hi Kin,

The index pattern logstash-2020.07.30 is created and can be discovered in elasticsearch. However under Add Log Data -> Logstash Log -> Module status - resulted "No data has been received from this module yet".

I have been trying this for many days. Can I have some more recommendation on this ?

Thanks,
Grace

Sorry, i guess you confused with my above post. My post was asking if you are receiving data at logstash from beats. (This will verify if your first leg of data transfer from beats to logstash is successful)

Also in Elastic, try to scan time period of your index to All time or large number. may be there is an issue with your @timestamp

Hi Kin,

The console seems able to get data from filebeat with error from mysql.
Here from console:

{
"input" => {
"type" => "log"
},
"@version" => "1",
"message" => "2020-07-30T06:46:35.784214Z 6 [ERROR] [MY-010584] [Repl] Slave I/O for channel '': error connecting to master 'rpl@ip:3306' - retry-time: 60 retries: 255 message: Host 'ip' is blocked because of many connection errors; unblock with 'mysqladmin flush-hosts', Error_code: MY-001129",
"log" => {
"file" => {
"path" => "/var/log/mysqld.log"
},
"offset" => 2373091
},
"host" => {
"id" => "c53dd0074710bd4e8fc8d0354ca04621",
"os" => {
"platform" => "ol",
"family" => "",
"kernel" => "4.14.35-1902.11.3.el7uek.x86_64",
"version" => "7.7",
"name" => "Oracle Linux Server"
},
"name" => "localhost.localdomain",
"containerized" => false,
"architecture" => "x86_64",
"hostname" => "localhost.localdomain"
},
"agent" => {
"type" => "filebeat",
"id" => "bda0c1ad-d375-483d-8888-ee47bc25bc04",
"ephemeral_id" => "f6ed92fb-17dd-4a24-abdf-6b57afe50461",
"version" => "7.2.0",
"hostname" => "localhost.localdomain"
},
"ecs" => {
"version" => "1.0.0"
},
"tags" => [
[0] "service-X",
[1] "web-tier",
[2] "beats_input_codec_plain_applied"
],
"@timestamp" => 2020-07-30T06:46:41.085Z
}

Hi Kin,

I am trying to reconfigure the logstash and filebeat again.
Changes I made to logstash config:


input {
beats {
port => "5044"
}
file {
path => "/u01/logstash/logstash-7.8.0/logs/logstash-plain.log"
type => "logstash"
}
}

output {
file {
path => "/u01/logstash/logstash-7.8.0/logs/logstash.log"
}
}


filebeat logstash.yml


log:
enabled: true

# Set custom paths for the log files. If left empty,
# Filebeat will choose the paths depending on your OS.
var.paths: ["/u01/logstash/logstash-7.8.0/logs/logstash.log*"]
var.format: plain

filebeat.yml: Changing output.elasticsearch again


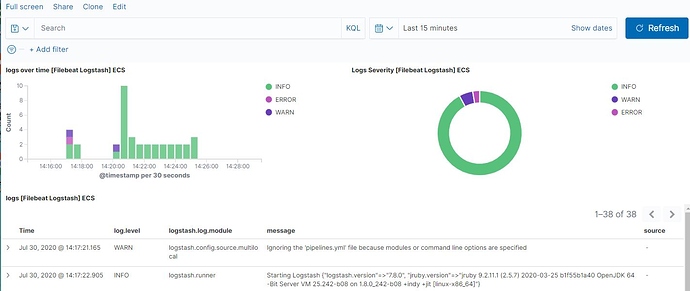
Data successfully received from this module


Please comment if any. I appreciated it,

Thanks,
Grace

In your logstash conf why are you putting "output" stanza to a file? It needs to be to elasticsearch

Hi Kin,

"The logstash Filebeat module parses debug and slow logs created by Logstash itself".

I was trying to configure filebeat to refer to logstash generated logstash-plain.log but failed to do so.

This topic was automatically closed 28 days after the last reply. New replies are no longer allowed.