Logstash GeoIp in Packetbeat pattern

hi, currently i'm trying to show GeoIp points using LogStash with Packetbeat and the best solution that I find is using this logstash-packtebeat.conf file:

input {
    beats {
        type => beats
        port => 5044
    }
}

filter{
  geoip {
    source => "[dest][ip]"
    target => "[client_geoip][location]"
  }
}

output {
    elasticsearch {
        hosts => ["localhost:9200"]
        index => "%{[@metadata][beat]}-%{[@metadata][version]}-%{+YYYY.MM.dd}"
    }
    stdout { codec => rubydebug }
}

Is this correct? Because it is not showing any hit in the dashboard [ Packetbeat] Overview it's not showing any hit on the request of field client_geoip.location

What do you get on stdout? If [dest][ip] contains an IP then that geoip should work.

        "dest" => {
    "ip" => "81.82.83.84"
},
"client_geoip" => {
    "location" => {
                    "ip" => "81.82.83.84",
         "country_code3" => "BE",
        "continent_code" => "EU",
           "region_name" => "Antwerp Province",

Thanks, Currently i'm getting this error:

miguel@familia-plazas ~> sudo /usr/share/logstash/bin/logstash -f /etc/logstash/conf.d/logstash-packetbeat.conf --path.settings=/etc/logstash
Sending Logstash logs to /var/log/logstash which is now configured via log4j2.properties
[2019-01-21T13:16:27,642][WARN ][logstash.config.source.multilocal] Ignoring the 'pipelines.yml' file because modules or command line options are specified
[2019-01-21T13:16:27,782][INFO ][logstash.runner          ] Starting Logstash {"logstash.version"=>"6.5.4"}
[2019-01-21T13:16:51,320][INFO ][logstash.pipeline        ] Starting pipeline {:pipeline_id=>"main", "pipeline.workers"=>2, "pipeline.batch.size"=>125, "pipeline.batch.delay"=>50}
[2019-01-21T13:16:54,060][INFO ][logstash.outputs.elasticsearch] Elasticsearch pool URLs updated {:changes=>{:removed=>[], :added=>[http://localhost:9200/]}}
[2019-01-21T13:16:54,805][WARN ][logstash.outputs.elasticsearch] Restored connection to ES instance {:url=>"http://localhost:9200/"}
[2019-01-21T13:16:55,109][INFO ][logstash.outputs.elasticsearch] ES Output version determined {:es_version=>6}
[2019-01-21T13:16:55,150][WARN ][logstash.outputs.elasticsearch] Detected a 6.x and above cluster: the `type` event field won't be used to determine the document _type {:es_version=>6}
[2019-01-21T13:16:55,282][INFO ][logstash.outputs.elasticsearch] New Elasticsearch output {:class=>"LogStash::Outputs::ElasticSearch", :hosts=>["//localhost:9200"]}
[2019-01-21T13:16:55,376][INFO ][logstash.outputs.elasticsearch] Using mapping template from {:path=>nil}
[2019-01-21T13:16:55,420][INFO ][logstash.filters.geoip   ] Using geoip database {:path=>"/usr/share/logstash/vendor/bundle/jruby/2.3.0/gems/logstash-filter-geoip-5.0.3-java/vendor/GeoLite2-City.mmdb"}
[2019-01-21T13:16:55,448][INFO ][logstash.outputs.elasticsearch] Attempting to install template {:manage_template=>{"template"=>"logstash-*", "version"=>60001, "settings"=>{"index.refresh_interval"=>"5s"}, "mappings"=>{"_default_"=>{"dynamic_templates"=>[{"message_field"=>{"path_match"=>"message", "match_mapping_type"=>"string", "mapping"=>{"type"=>"text", "norms"=>false}}}, {"string_fields"=>{"match"=>"*", "match_mapping_type"=>"string", "mapping"=>{"type"=>"text", "norms"=>false, "fields"=>{"keyword"=>{"type"=>"keyword", "ignore_above"=>256}}}}}], "properties"=>{"@timestamp"=>{"type"=>"date"}, "@version"=>{"type"=>"keyword"}, "geoip"=>{"dynamic"=>true, "properties"=>{"ip"=>{"type"=>"ip"}, "location"=>{"type"=>"geo_point"}, "latitude"=>{"type"=>"half_float"}, "longitude"=>{"type"=>"half_float"}}}}}}}}
[2019-01-21T13:16:56,873][INFO ][logstash.inputs.beats    ] Beats inputs: Starting input listener {:address=>"0.0.0.0:5044"}
[2019-01-21T13:16:56,929][INFO ][logstash.pipeline        ] Pipeline started successfully {:pipeline_id=>"main", :thread=>"#<Thread:0x6c305fbc run>"}
[2019-01-21T13:16:57,197][INFO ][logstash.agent           ] Pipelines running {:count=>1, :running_pipelines=>[:main], :non_running_pipelines=>[]}
[2019-01-21T13:16:57,373][INFO ][org.logstash.beats.Server] Starting server on port: 5044
[2019-01-21T13:16:58,198][INFO ][logstash.agent           ] Successfully started Logstash API endpoint {:port=>9600}
[2019-01-21T13:17:13,344][INFO ][org.logstash.beats.BeatsHandler] [local: 127.0.0.1:5044, remote: 127.0.0.1:41582] Handling exception: org.logstash.beats.BeatsParser$InvalidFrameProtocolException: Invalid Frame Type, received: 69
[2019-01-21T13:17:13,350][WARN ][io.netty.channel.DefaultChannelPipeline] An exceptionCaught() event was fired, and it reached at the tail of the pipeline. It usually means the last handler in the pipeline did not handle the exception.
io.netty.handler.codec.DecoderException: org.logstash.beats.BeatsParser$InvalidFrameProtocolException: Invalid Frame Type, received: 69
	at io.netty.handler.codec.ByteToMessageDecoder.callDecode(ByteToMessageDecoder.java:459) ~[netty-all-4.1.18.Final.jar:4.1.18.Final]
	at io.netty.handler.codec.ByteToMessageDecoder.channelRead(ByteToMessageDecoder.java:265) ~[netty-all-4.1.18.Final.jar:4.1.18.Final]
	at io.netty.channel.AbstractChannelHandlerContext.invokeChannelRead(AbstractChannelHandlerContext.java:362) ~[netty-all-4.1.18.Final.jar:4.1.18.Final]
	at io.netty.channel.AbstractChannelHandlerContext.access$600(AbstractChannelHandlerContext.java:38) ~[netty-all-4.1.18.Final.jar:4.1.18.Final]
	at io.netty.channel.AbstractChannelHandlerContext$7.run(AbstractChannelHandlerContext.java:353) ~[netty-all-4.1.18.Final.jar:4.1.18.Final]
	at io.netty.util.concurrent.DefaultEventExecutor.run(DefaultEventExecutor.java:66) ~[netty-all-4.1.18.Final.jar:4.1.18.Final]
	at io.netty.util.concurrent.SingleThreadEventExecutor$5.run(SingleThreadEventExecutor.java:858) [netty-all-4.1.18.Final.jar:4.1.18.Final]
	at io.netty.util.concurrent.FastThreadLocalRunnable.run(FastThreadLocalRunnable.java:30) [netty-all-4.1.18.Final.jar:4.1.18.Final]
	at java.lang.Thread.run(Thread.java:748) [?:1.8.0_191]
Caused by: org.logstash.beats.BeatsParser$InvalidFrameProtocolException: Invalid Frame Type, received: 69
	at org.logstash.beats.BeatsParser.decode(BeatsParser.java:92) ~[logstash-input-beats-5.1.6.jar:?]
	at io.netty.handler.codec.ByteToMessageDecoder.decodeRemovalReentryProtection(ByteToMessageDecoder.java:489) ~[netty-all-4.1.18.Final.jar:4.1.18.Final]
	at io.netty.handler.codec.ByteToMessageDecoder.callDecode(ByteToMessageDecoder.java:428) ~[netty-all-4.1.18.Final.jar:4.1.18.Final]
	... 8 more

it's because local ip's?

Local IPs should be OK. It could be that logstash and packetbeat disagree on whether SSL should be enabled, or you have told packetbeat to use an elasticsearch output rather than a logstash output, or one of several other things.

Can you confirm that the program owning remote: 127.0.0.1:41582 is packetbeat?

Sorry, It was my fault. I fixed configuring packetbeat.yml corrently defining as fiollows:

#----------------------------- Logstash output --------------------------------
output.logstash:
  # The Logstash hosts
  hosts: ["localhost:5044"]

And, logstash is ingesting data:

{
            "tags" => [
        [0] "beats_input_raw_event",
        [1] "_geoip_lookup_failure"
    ],
       "transport" => "tcp",
            "host" => {
         "architecture" => "x86_64",
                 "name" => "familia-plazas",
                   "id" => "39093280d1f94480b3295044c456e3d0",
                   "os" => {
              "family" => "debian",
            "codename" => "xenial",
            "platform" => "ubuntu",
             "version" => "16.04.5 LTS (Xenial Xerus)"
        },
        "containerized" => false
    },
            "beat" => {
            "name" => "familia-plazas",
        "hostname" => "familia-plazas",
         "version" => "6.5.4"
    },
         "flow_id" => "EAT/////AP//////CP8AAAF/AAABfwAAAVKjrRM",
           "final" => false,
    "client_geoip" => {
        "location" => {}
    },
      "@timestamp" => 2019-01-21T18:44:20.000Z,
          "source" => {
         "port" => 41810,
        "stats" => {
            "net_packets_total" => 1,
              "net_bytes_total" => 76
        },
           "ip" => "127.0.0.1"
    },
            "dest" => {
         "port" => 5037,
        "stats" => {
            "net_packets_total" => 1,
              "net_bytes_total" => 56
        },
           "ip" => "127.0.0.1"
    },
       "last_time" => "2019-01-21T18:43:55.251Z",
            "type" => "flow",
        "@version" => "1",
      "start_time" => "2019-01-21T18:43:55.251Z"
}

And here are some WARN logs:

[2019-01-21T13:51:59,181][WARN ][logstash.outputs.elasticsearch] Could not index event to Elasticsearch. {:status=>400, :action=>["index", {:_id=>nil, :_index=>"packetbeat-6.5.4-2019.01.21", :_type=>"doc", :routing=>nil}, #<LogStash::Event:0x85464c7>], :response=>{"index"=>{"_index"=>"packetbeat-6.5.4-2019.01.21", "_type"=>"doc", "_id"=>"yqLBcWgBO-eHSZ_RR-lB", "status"=>400, "error"=>{"type"=>"mapper_parsing_exception", "reason"=>"failed to parse", "caused_by"=>{"type"=>"parse_exception", "reason"=>"field [lat] missing"}}}}}
[2019-01-21T13:51:59,183][WARN ][logstash.outputs.elasticsearch] Could not index event to Elasticsearch. {:status=>400, :action=>["index", {:_id=>nil, :_index=>"packetbeat-6.5.4-2019.01.21", :_type=>"doc", :routing=>nil}, #<LogStash::Event:0x6e485def>], :response=>{"index"=>{"_index"=>"packetbeat-6.5.4-2019.01.21", "_type"=>"doc", "_id"=>"y6LBcWgBO-eHSZ_RR-lB", "status"=>400, "error"=>{"type"=>"mapper_parsing_exception", "reason"=>"failed to parse", "caused_by"=>{"type"=>"parse_exception", "reason"=>"field must be either [lat], [lon] or [geohash]"}}}}}

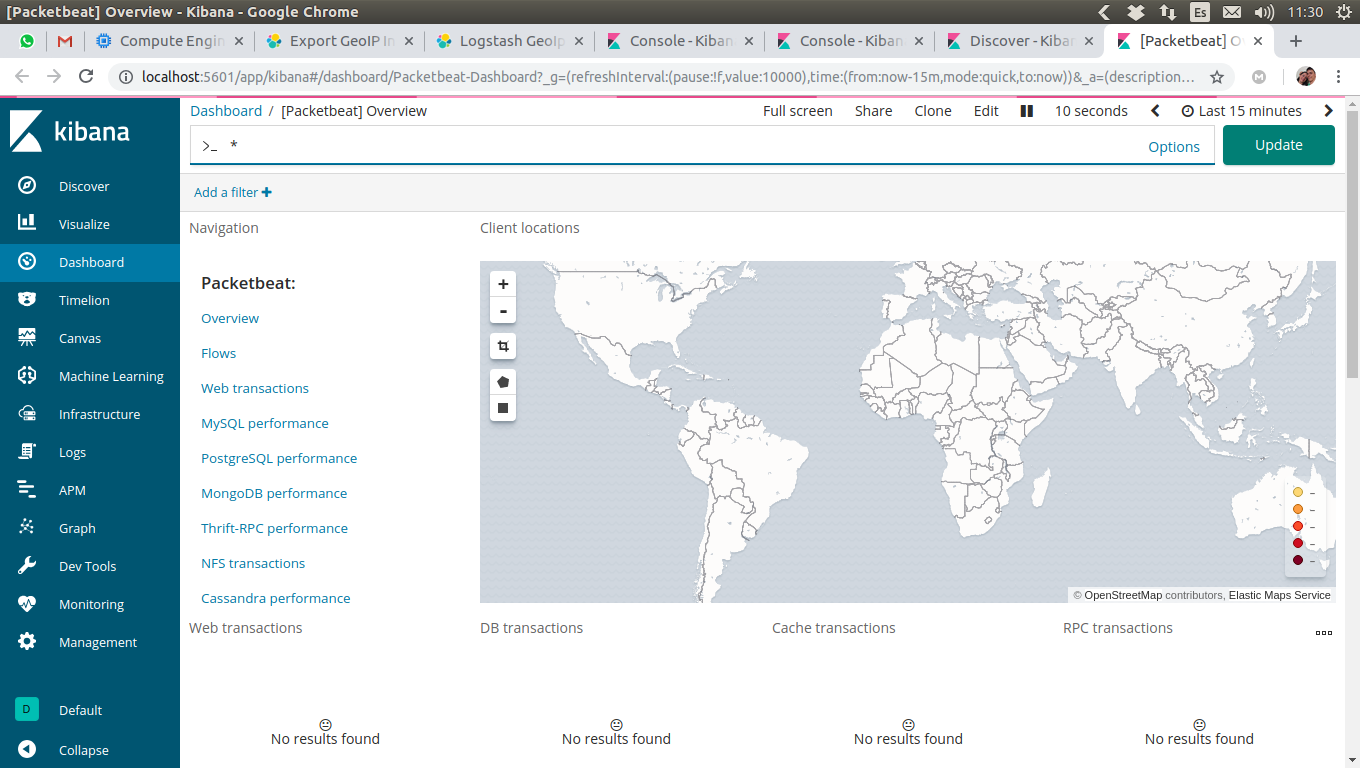
But still doesn't showing any geoip point:

You got an _geoip_lookup_failure tag because geoip has no way of knowing where 127.0.0.1 is. Mine is in Virginia, but yours may be somewhere else :smiley:

The WARN messages are actually good news, because they suggest your index mapping is correctly set up to expect a geo_point for location. Once you get geoip working I would expect them to disappear.

Thanks, but still not working, it's not showing anything, and no match:

image

This is the request:

{
  "aggs": {
    "filter_agg": {
      "filter": {
        "geo_bounding_box": {
          "ignore_unmapped": true,
          "client_geoip.location": {
            "top_left": {
              "lat": 90,
              "lon": -180
            },
            "bottom_right": {
              "lat": -90,
              "lon": 180
            }
          }
        }
      },
      "aggs": {
        "2": {
          "geohash_grid": {
            "field": "client_geoip.location",
            "precision": 2
          },
          "aggs": {
            "3": {
              "geo_centroid": {
                "field": "client_geoip.location"
              }
            }
          }
        }
      }
    }
  },
  "size": 0,
  "_source": {
    "excludes": []
  },
  "stored_fields": [
    "*"
  ],
  "script_fields": {},
  "docvalue_fields": [
    {
      "field": "@timestamp",
      "format": "date_time"
    },
    {
      "field": "last_time",
      "format": "date_time"
    },
    {
      "field": "start_time",
      "format": "date_time"
    },
    {
      "field": "tls.client_certificate.not_after",
      "format": "date_time"
    },
    {
      "field": "tls.client_certificate.not_before",
      "format": "date_time"
    },
    {
      "field": "tls.server_certificate.not_after",
      "format": "date_time"
    },
    {
      "field": "tls.server_certificate.not_before",
      "format": "date_time"
    }
  ],
  "query": {
    "bool": {
      "must": [
        {
          "query_string": {
            "query": "*",
            "analyze_wildcard": true,
            "default_field": "*"
          }
        },
        {
          "query_string": {
            "analyze_wildcard": true,
            "query": "*",
            "default_field": "*"
          }
        },
        {
          "range": {
            "@timestamp": {
              "gte": 1548166338211,
              "lte": 1548167238211,
              "format": "epoch_millis"
            }
          }
        }
      ],
      "filter": [],
      "should": [],
      "must_not": []
    }
  }
}

What could be the problem? and How can i prove that the config file it's doing it works?

If you want to know whether logstash is doing what you want then look at the events written to stdout. Leave elasticsearch and kibana out of it. You already have

stdout { codec => rubydebug }

in your configuration. Are you able to view that output?

I think it's ingesting:

!

But it still not showing anything :disappointed_relieved:

I tried with Packetbeatgeoip, and neither :sob:

I followed this steps: https://www.elastic.co/guide/en/beats/packetbeat/current/packetbeat-geoip.html

Installing the plugin:
sudo /usr/share/elasticsearch/bin/elasticsearch-plugin install ingest-geoip

Adding ingest pipeline:

Modifing output of packetbeat.yml:
output.elasticsearch:
hosts: ["localhost:9200"]
pipeline: geoip-info

Starting Packetbeat with new configs:
sudo /usr/share/packetbeat/bin/packetbeat -e -c /etc/packetbeat/packetbeat.yml

In console it's showing this:

and i think it's indexing:

but as i mention before, still not working :sob::sob::sob::sob:

The client_ip is in the 192.168/16 net block. That cannot be geolocated because it is used at different locations by different organizations. If you try doing geoip on the ip field you should get a hit on Mountain View.

So, theoretically if i follow the steps of the ingest geoip plugin in a server it will work?

This is a bar-plot of client_ip:

Unfortunately none of those client_ip value will get a match grom geoip.

Thanks. Something curious is that when I don't use neither LogStash or Plugin GeoIp, just using Packbeat, It looks like clien_ip is getting external data:

So, the LogStas config or GeoIp Elastic Plugin is filtering all other ip's? I'm confuse in this point.

This topic was automatically closed 28 days after the last reply. New replies are no longer allowed.